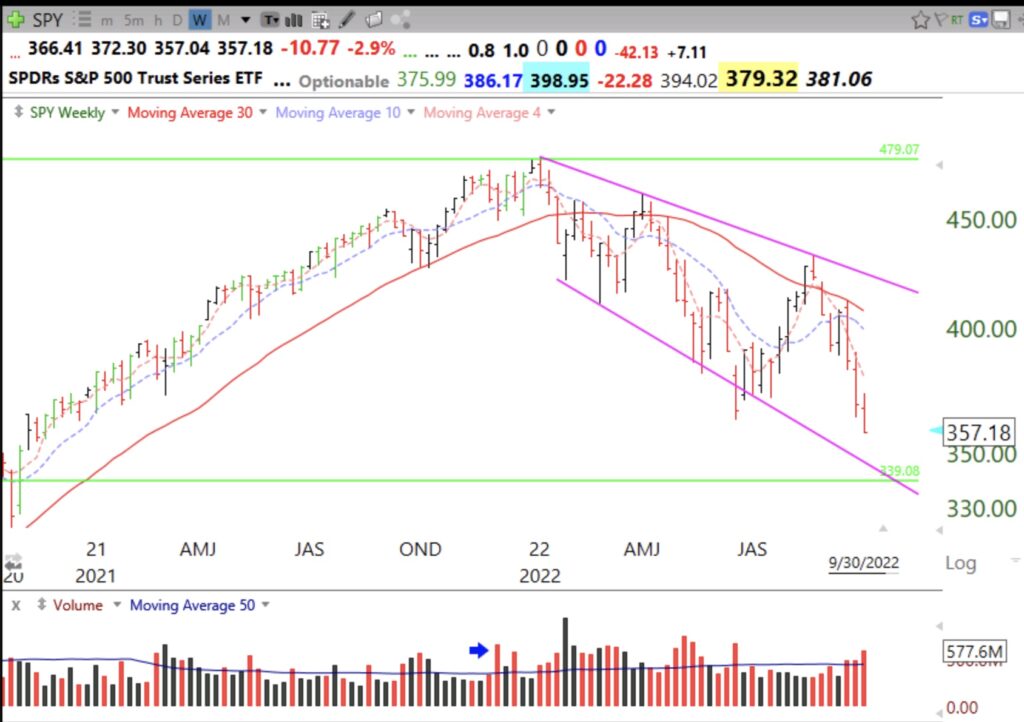
I drew this lower trend channel line (thank you Vas!) months ago and suggested that SPY may decline to hit it again, right at the last green line break-out. This is a weekly chart. Note the blue arrow in the volume section. That high volume decline was one of the factors that got me out of the market at the end of last year. Another factor was the growing number of new daily lows occurring even as the index was still climbing.
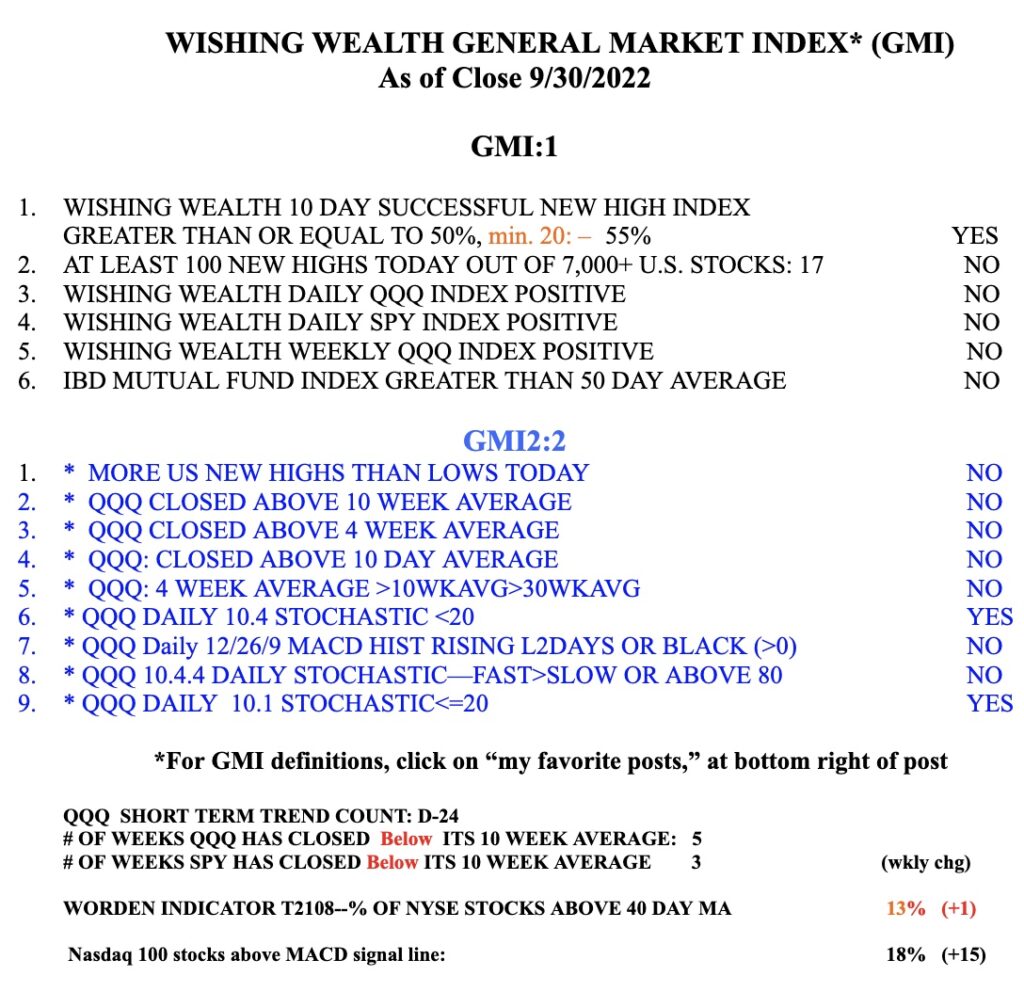
The GMI remains on a Red signal and I am in cash.

