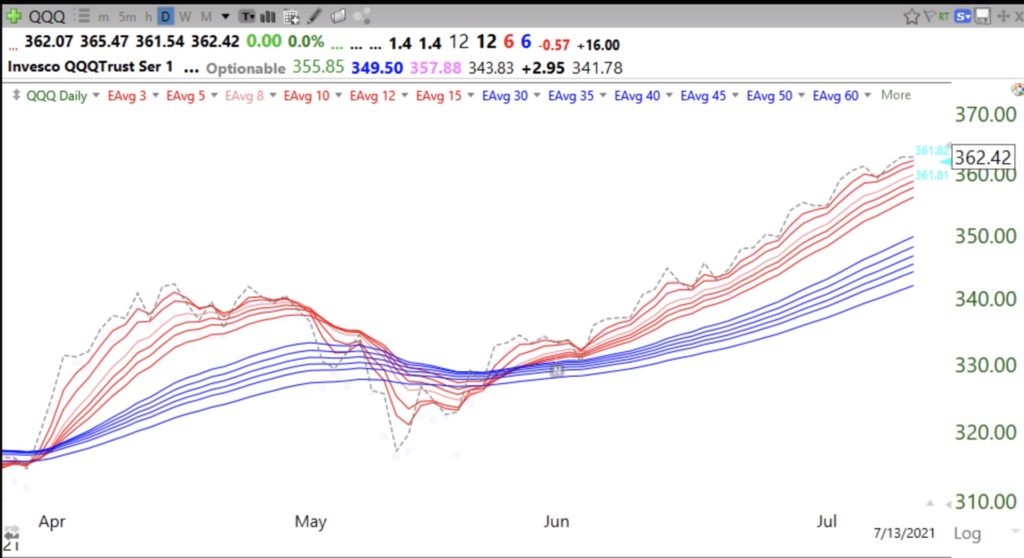
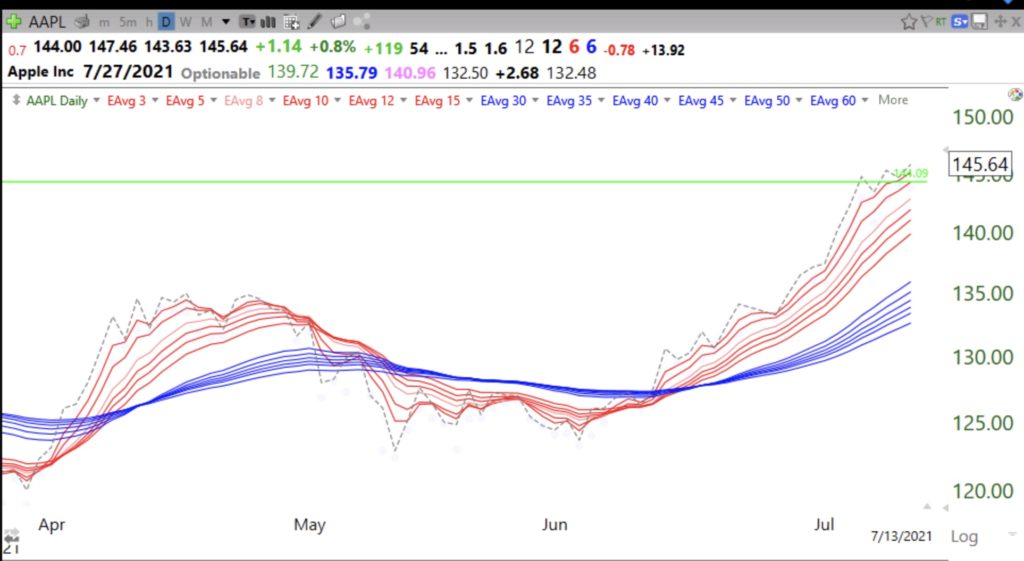
RWB up-trend means that all 6 shorter term averages (red) are rising above 6 longer term averages (blue) with a white space between them. The black dotted line is the daily close. The first sign of weakness occurs when the dotted line goes below the red lines, leading them lower. This is a modified GMMA chart, invented by Daryl Guppy.
AAPL shows a similar pattern and a recent GLB to ATH.

