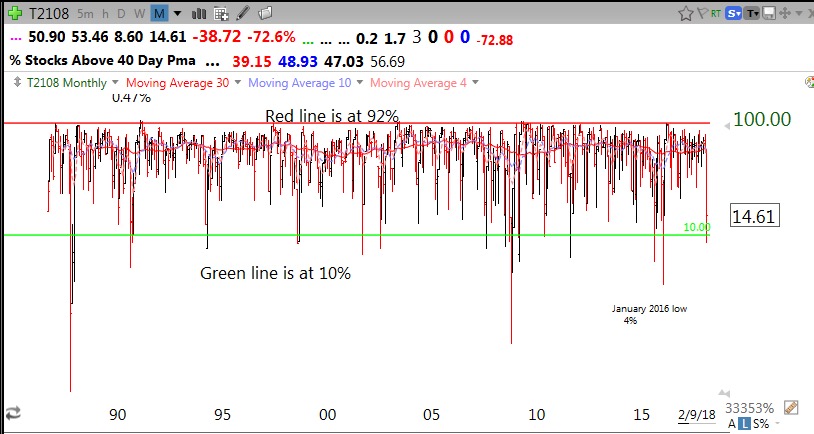
I show my students each semester this monthly chart of T2108 going back to when Worden created it in 1986. (You can access T2108 with Worden chart analysis software.) T2108 measures the percentage of NYSE stocks that are above their simple 40 day moving average of price. The few times since 1986 when T2108 was below 10% the market was severely oversold and did not remain there long. Once, in 1987, it registered its lowest, <1%. I call T2108 the pendulum of the market, moving from extremely oversold to overbought levels. The red and green lines in this monthly chart mark these levels.
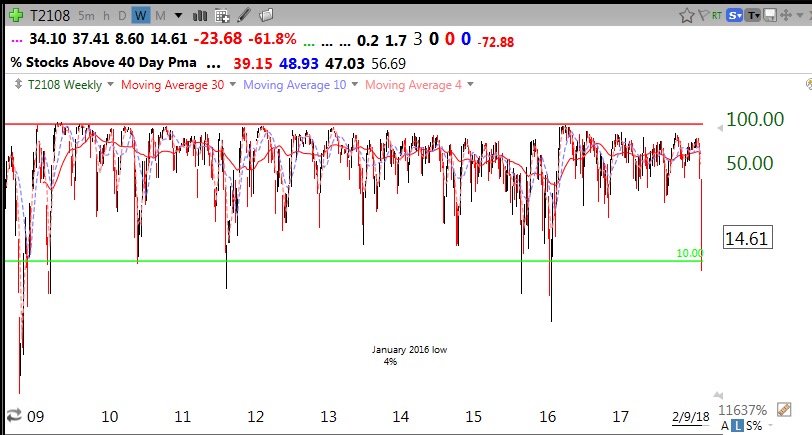
Here is a more recent weekly chart of T2108 since 2008.
A maximum of one or two weeks below 10% is the norm. On Friday, T2108 traded as low as 8.6% and closed at 14.6%. In addition, the put/call ratio closed at an extremely high 1.27, indicating that a lot of option traders were buying puts and/or insurance against a decline. This ratio is another contrarian indicator with extreme levels of bearishness usually occurring near short term bottoms. The market always bounces after readings above 1.2.
I closed out my SQQQ (3x leveraged bearish QQQ ETF) on Friday with a nice gain. I did not have the courage to follow my rule to buy the market, SPY (I never do!) on Friday but am looking to make a small pilot buy this week. (This will be a small initial purchase and I will only add to it on the way up if the lows hold)…….
I love weak markets because only a small number of stocks hit all-time highs. Those that do amidst market carnage may turn out to include new leaders when the market turns up. Imagine a stock hitting an all-time high (ATH) last week! These are stocks worth researching and monitoring because someone is accumulating them. Each of these stocks hit an ATH on Thursday or Friday and are above a recent GLB (green line break-out, see blog glossary above):
COLM, ARRY, BLBD, VIRT, WWE, GRUB, PIRS, INST, MC, MCFT, HAE, HLG.
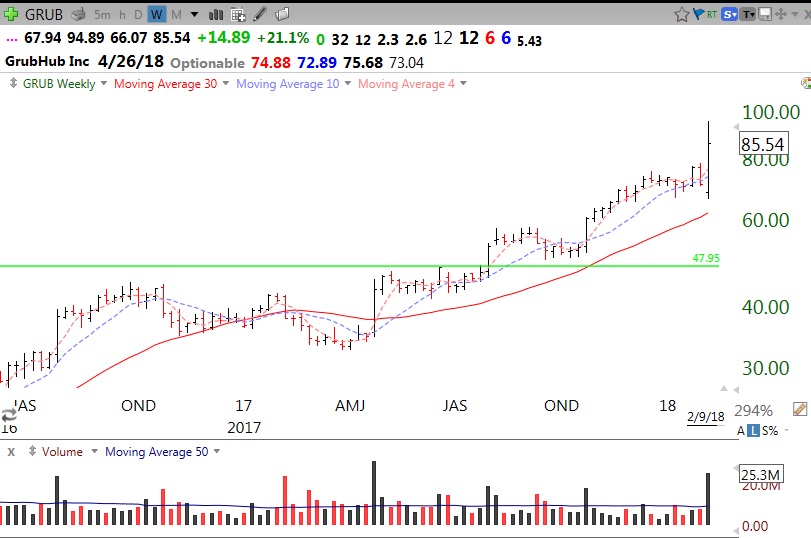
As an example, this weekly chart shows GRUB’s high volume move up last week after beating earnings estimates. I will look for an entry once it consolidates.
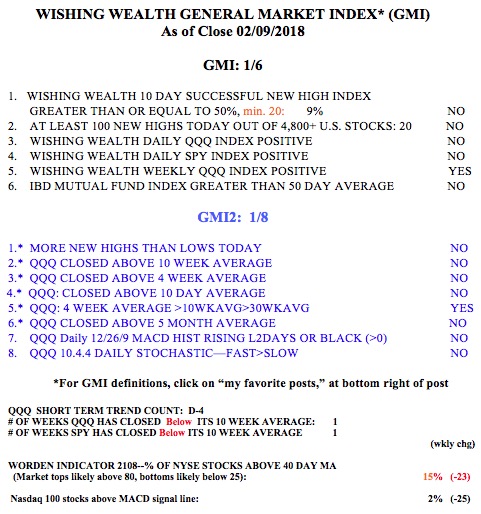
The GMI remains on a Red signal and indicates the need for caution. IBD now sees the market in a correction. Both the QQQ and SPY are now below their 10 week averages, a critical sign of weakness.


