My RWB daily charts provide me with an extraordinary way to visualize a stock’s pattern and to choose entries and exits. You will recall that an RWB chart has 13 daily exponential moving averages plotted on a white background. The six red lines represent the shorter term averages and the six blue lines represent the longer term averages. The 13th average is a gray dotted line with an average=1 and represents each daily close.
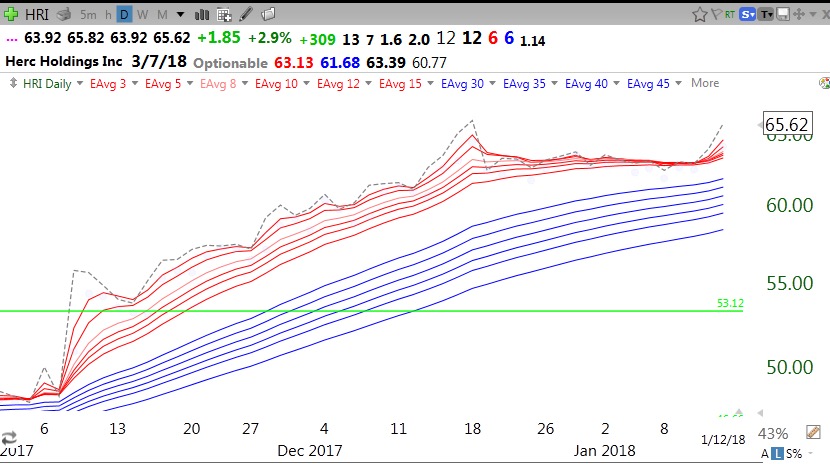
In an advance, the dotted line, or daily closes mostly are above all of the rising red lines. The red lines are rising above the blue lines and there is a white space between them–this is an RWB (red/white and blue) up-trend. Strong stocks can remain in this pattern for weeks and even months. The key for me is to buy a RWB pattern stock when it bounces up from support. One way of defining a bounce is to find an RWB up-trend where the stock has recently closed below 5 or 6 of the rising red lines and then closes back above all of the red lines. I have created a scan that is available free to all TC2000 users in the Dr. Wish club. That scan, 12252017BounceRWBdaily, identifies all US stocks with the pattern I just described. One stock that this scan found this weekend is HRI.
Note that for most of November and December HRI was in a perfect RWB daily up-trend closing almost every day above all of the red line averages. In mid-November, HRI consolidated, evidenced by the convergence of all of the declining red lines. This is a base. The key is to buy the stock if and when it emerges up from its base. Clearly, at the end of last week, HRI started to advance again, and closed above all of the red lines after having closed recently below all of the red lines. This is the pattern that this scan searches for. In addition, note that HRI is near its highest price ever, as indicated that it is above its recent green line break-out (GLB) to an all-time high. Note on the top line of the chart that HRI’s recent quarterly earnings were up +309%. I like good fundamentals as well as technicals.
I have no idea whether HRI will keep advancing out of this base. However, the beauty of this approach is that I know in advance how to define a failed break-out. If a stock closes back below all of its red lines for 1 or 2 days, I consider the break-out to have failed and I exit. The nice thing about this strategy is that before I purchase I can look at the value of the lowest red line (the 15 day exponential average in an up-trend) which is posted on my chart, here= 63.13. HRI closed 2.49 above this value and the difference represents the probable loss if I bought around 65.62 on Monday and had to sell just below the red lines. Thus this strategy enables me to estimate and limit my losses in advance.
My biggest problem is selling a rising stock too soon. I get scared out when it or the market zigs down and I am afraid of relinquishing my profit. Using this buying strategy, I try to hold on until the stock closes below all of its red lines for 2 days. An analysis of my recent sales shows that this technique would have served me well and kept me in stocks that kept rising.
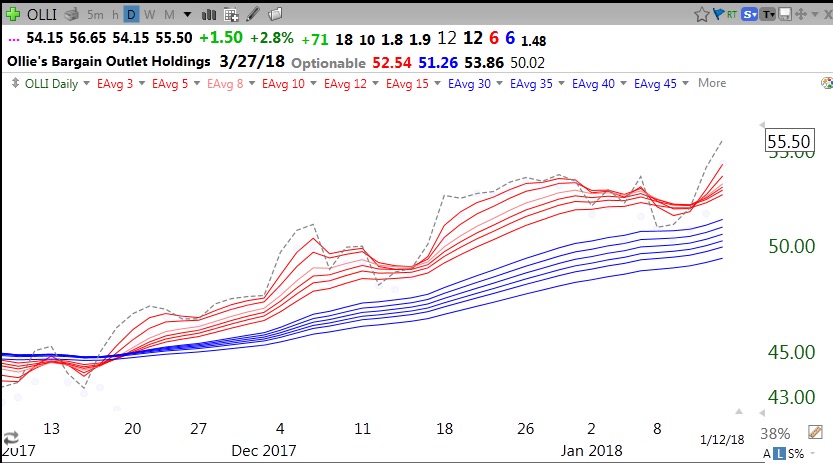
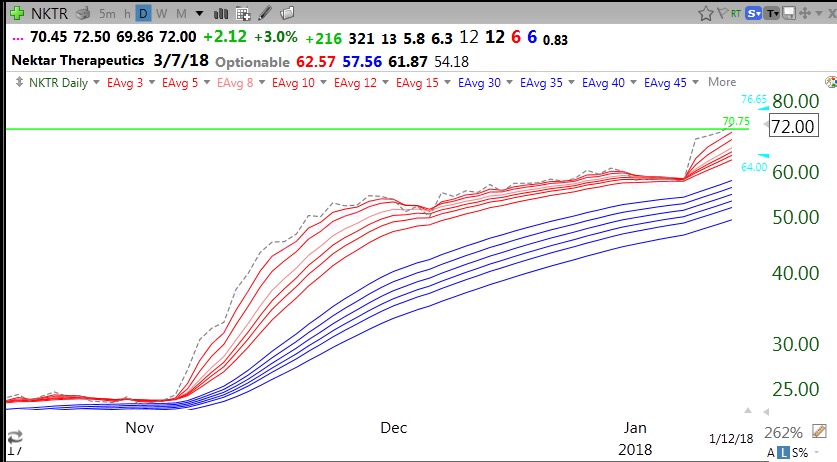
Some other stocks that came up on this scan are: ATRO, SGMO, SRPT, OLLI, NKTR and ROG. Check them out! Here is OLLI:
And NKTR:
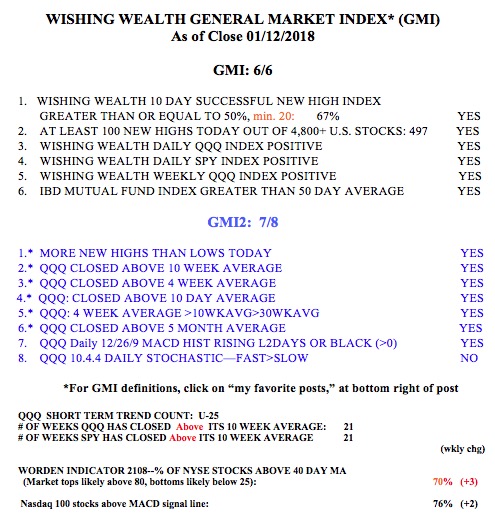
The GMI remains at 6 (of 6):


