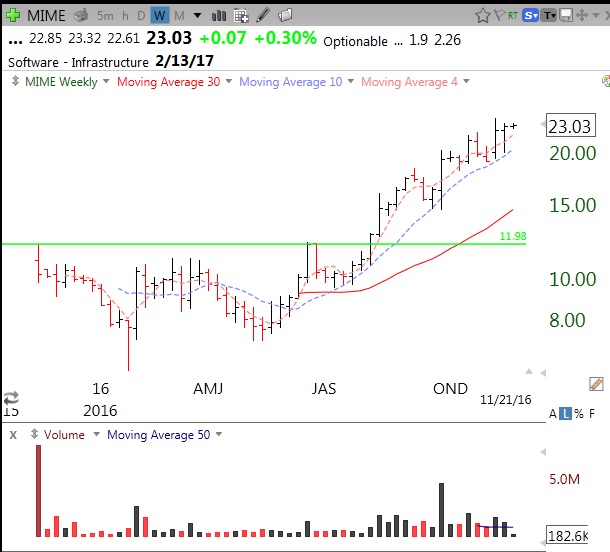
This weekly chart of the 2015 IPO, MIME, shows it steadily advancing since it had a GLB in August. Its 4wk avg>10wk avg>30wk avg is the strong bullish pattern described in my prior post. MIME finds strong support at its 10 week average (blue dotted line).
