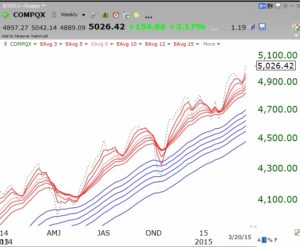
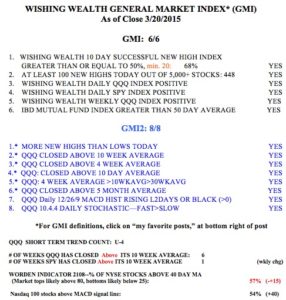
IBD says the market uptrend has resumed. All of my GMI and GMI2 components are positive. This GMMA chart of the NASDAQ Composite index shows it to be in a strong RWB up-trend. Note the weekly close (dotted line) is back above all of the other moving averages. 
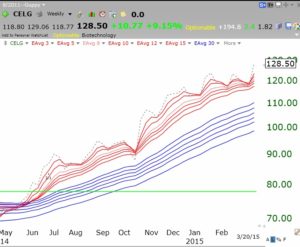
I use TC2000 to scan for RWB stocks where the dotted line has climbed back above all of the other averages. This alerts me to advancing stocks that may have consolidated and have now resumed their up-trends. Below is an example. CELG is above a green line top, is in an RWB pattern and has just moved above all of its averages. I have had a lot of success trading such patterns. I think a key to success is that these charts are based on weekly patterns and the dotted line keeps me from being scared out of stocks based on daily volatility. The dotted line tracks today’s close relative to prior weekly closes.
As for the GMI:

