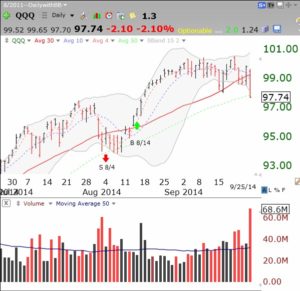
With the failure of Wednesday’s rebound, the indexes are likely to enter short term down-trends on Thursday. This is the time to step away and watch from the sidelines. This daily chart of the QQQ shows it broke below support on the highest volume in months.
The longer term trend of the QQQ remains up, however. I have very small positions in my trading accounts. My university pension remains invested in mutual funds for now. With the put/call ratio at 1.11 and the T2108 at 22, we could see at least a short term bounce very soon.
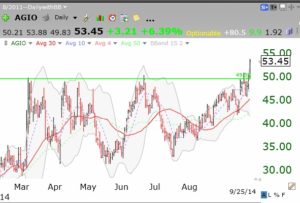
One recent green line break-out stock had a great day on Thursday. Check out this daily chart of AGIO.


Dr. Wish, am I looking at this correctly? I see only two criteria for the GMI2 that are “Yes.†These are factor 5 (QQQ 4 week avg>10 week avg>30 week avg) and factor 6 (QQQ closed above 5 month average). However, you are showing 3 factors as “Yes.†What is the other factor that is “Yes�
Thanks in advance for your comments.
Rick you are right again–thank you. I must have been looking at the QQQ weekly histograms which were black. Count for GMI-2 should have been 2. Remember though that GMI-2 is just a set of indicators that I want to remember to watch. Unlike the GMI, I do not focus a lot on the sum.