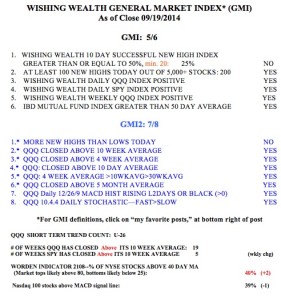
There are some very curious statistics tied to the current market. At a time when the SPY, and DIA are near new all-time highs, the measures of the market internals are weak. For example, why is the T2108 only at 40%? This means that only 40% of NYSE stocks closed Friday above their 40 day average prices. In June, T2108 was above 70%! The Wishing Wealth 10 Day Successful New High indicator showed only 25% of the stocks that hit a new 52 week high 10 days ago closed higher on Friday than they closed 10 days earlier. In contrast 68% of the stocks that hit a new low 10 days ago closed lower on Friday than 10 days earlier. And there were as many stocks hitting a new high on Friday as hit a new low. That is very strange. Why should 200 stocks be hitting new lows? And on Friday, only 32% of all U.S. stocks and 24% of the Nasdaq 100 stocks rose! Could it be that the few hugely favored growth stocks are driving the indexes while the rest of the market is weakening. Years ago in the 1960’s and 1970’s such a phenomenon occurred with the “nifty 50”. All one had to do was to invest in these high growth “one decision” stocks and one’s investments would be assured. We all know how that investing strategy failed in the bear markets of the 60’s and in 1974. Perhaps AAPL, AMZN, GOOG and TSLA are among this cycle’s one decision stocks. At some point they may join the majority of stocks that have been silently weakening…
