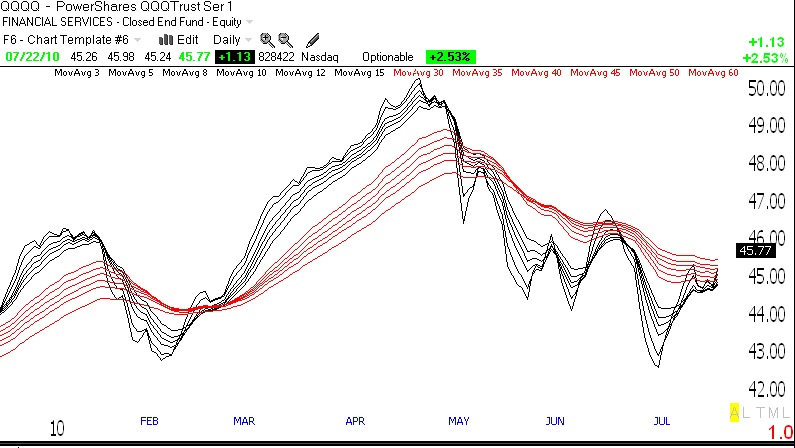
The indexes are very close to breaking above their key longer term moving averages. There were 134 new 52 week highs and only 17 new lows in my universe of 4,000 stocks on Thursday. The Worden T2108 Indicator is now at 70%, almost in overbought territory. The GMI is at 4. The IBD Mutual Fund Index is now above its 50 day average, which is still declining. The key is not to jump the gun but to wait for a definite signal of a longer term up-trend. The GMMA daily chart of the QQQQ (click on chart to enlarge) shows that the short term averages (black) are climbing up through the longer term averages (red)–but they are not there yet!