When the market has been in short and long term down-trends, and then it goes up 5% in four days (measured by the Nadaq 100 ETF, QQQQ) , one is left with the question of whether it is time to go long? The truth is that no one knows for sure if the current rally is the start of a new up-trend or just a dead cat bounce. How we trade this scenario has to be guided by what our trading rules tell us to do.
My rules tell me that when we are in short and long term down-trends that I do not go long until both trends have signaled a new up-trend. This means that if this rally is the start of a new up-trend, I will miss some of the gains, but such is the fate of the trend follower. We follow defined trends until they end and a new trend is established.
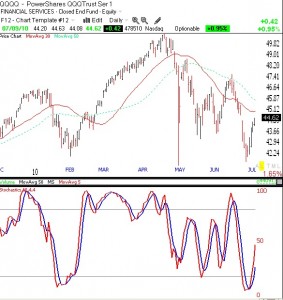
With clear 20/20 hindsight, I realize now that last week, I was not focusing enough on the extreme bearish sentiment that signaled that at least a bounce was likely. First, the QQQQ declined seven days in a row–a rare occurrence. The put/call ratio (number of put options traded divided by the number of call options traded) reached about 1.2, showing that option players were more likely to trade as if stocks would decline. This is a decent contrary indicator–at extreme values, these traders tend to be wrong. The Investor’s Intelligence survey of newsletter sentiment, another contrary indicator, shows that there are nearly as many bears as bulls. Most of the time the bulls far outnumber the bears. And finally, the daily (10,4,4) stochastic indicator that I use to time trades was extremely oversold, near zero. Look at the daily chart of the QQQQ below (click on to enlarge) and you can see that market bounces tend to occur when the stochastic is around 20 (bottom horizontal line) and starts to rise. I should probably not be looking to initiate short trades on the market when this stochastic is below 50, and certainly, not when it is near zero. The stochastic acts much like the T2108 Indicator; it is sort of a pendulum of market sentiment. The stochastic indicator works for ETF’s as well as individual stocks.
The stochastic reached its lowest reading of the year before the July 4th weekend break, and then started rising. I am now waiting to see if the rally will end after the stochastic rises to the high levels seen at other tops this year. It may take a few more days of a rally until the stochastic reaches overbought levels again, or it may never get up there….
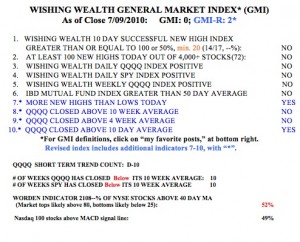
The GMI remains at zero but the more sensitive GMI-R is at 2. The rise in the GMI-R occurred because there were more new highs than lows on Friday in my universe of 4,000 stocks and because the QQQQ has closed above its 10 day average.  There has also been improvement in the Worden T2108 Indicator (52%), and almost one half (49%) of the Nasdaq 100 stocks have their MACD above its signal line, a sign of short term strength. But we remain in a QQQQ short term down-trend, now having completed its 10th day. And the QQQQ and SPY have now closed below their critical 10 week averages for 10 weeks. I find that I only trade growth stocks profitably on the long side when the QQQQ closes above its 10 week average.
So, according to my trading rules, I must remain mainly in cash and a little short until my indicators turn.

With extreme oversold indicators it might be a low risk time to remove short positions, but not take long positions until the trend changes?
If present is like recent past, likely we’ll see some pleasant upside for the week. S&P needs to break 1090. But buying volume has been low.
Action will be clear beginning of next week.
“This is a decent contrary indicator–at extreme values, these traders tend to be wrong.”
Is it that they are ‘wrong’ or that they might be closing out positions on down days? For this answer one would have to look at open put positions the days before, during and after a move to know which is ‘right’. I do agree with the idea that it is a contrary indicator, but have trouble agreeing with the why- does the why even matter?