When I teach my class to honors students I find that the biggest mistake they make in trading is buying a stock when it is too extended from support. They buy when it is extended and then sell as it falls back to support. I did that a lot until I reviewed several losses and discovered that pattern. To make money, all I had to do was to reverse my actions–buy where I had been selling and sell where I had been buying. But how can one do that effectively?
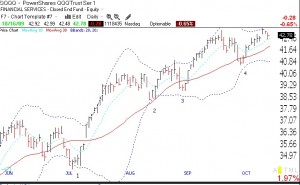
I have found that Bollinger bands can help me to time my purchases. Bollinger bands simply plot an envelope that is a given distance around an average price. I am using the simple 20 day moving average and plotting the values 2 standard deviations above and below this average.  The standard deviation I use is simply the average deviation of the daily closes around the average of the last 20 daily closes, and represents a measure of variability around the mean. In a normal distribution, one would expect that 95% of the daily closes would fit within plus or minus 2 standard deviations of the mean. If you don’t understand what I wrote you can still use Bollinger bands. All it means is that the stock should mainly close within the top and bottom Bollinger bands. You will need to click on this chart to see the bands clearly. I have numbered 4 times in which the QQQQ got close to the bottom band and then turned up. By buying at those times I had a good chance of profiting. When the price gets close to the upper band it is often too extended and unlikely to keep rising. So, right now we are coming down from the upper band and it might be a good idea to wait for the QQQQ to get closer to the lower band and turn up to make new purchases…….
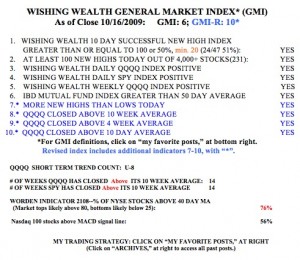
So, the GMI is back to 6 (of 6) and the GMI-R is 10 (of 10).  The market remains in an up-trend and I am fully invested in mutual funds in my university pension. In my trading IRA, I had a lot of puts I sold expire worthless this weekend. I plan to buy some TYH if the QQQQ bounces off of its lower Bollinger band. I always wade into TYH slowly, buying as each prior purchase shows a profit. I love to buy as my stock rises. I always use a sell stop to get me out if the stock falls.
Thanks Dr. Wish. This is a really good explanation of how Bollinger bands work and how they can be useful to avoid buying overextended stocks/ETFs.
Dr wish loved this post. I have never used them before because I hadn’t taken the time to understand them. Great explanation.
Hope things are Well with ya
Interesting article for you (maybe a retirement gig):
http://www.nytimes.com/2009/10/19/technology/start-ups/19kaching.html