The GMI and GMI-R remain at 1. There were 268 new lows and 33 new highs in my universe of 4,000 stocks on Friday. The number of new lows is much less than the number (519) on November 8 and suggests that most of the weakest stocks are not continuing to decline. The Worden T2108 indicator is now at 22%, up from the low of 19% reached on November 12. On Friday, 16% of the Nasdaq 100 stocks closed above their 30 day averages, up from 11% on November 12. Only 12% of my universe of stocks are in an up-trend, near the low point reached on November 14%, but still above the low of 7% reached last August at the bottom of the summer decline.
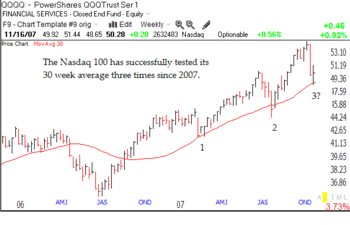
The Nasdaq 100 declined really rapidly from November 7-12. The index was in a vertical free fall more characteristic of selling climaxes. We would therefore expect some back and forth movement of this index as traders adjust to this collapse and place their bets on a continuing up or down trend. The reason that the GMI and GMI-R still register 1 is that the Weekly QQQQ Index remains positive. This index is my primary indicator of a longer term up or down move.  This weekly chart of the QQQQ (click on to enlarge)provides me with a clearer view of the market’s longer term trend. It is obvious to me that the major trend of the QQQQ remains up and that the Nasdaq 100 index has just found support at its critical 30 week average (red line). I put a “?” next to the third test because it remains to be seen whether this support will hold. It was the reversal of the 30 week average in Oct 2000 that caused me to exit the markets near the top. Stan Weinstein (see his book to the right) alerted me to the importance of the 30 week average for detecting individual stock and entire market longer term trends. DISCERN THE TREND FROM WHAT THE MARKET IS DOING, NOT FROM WHAT THE PUNDITS ARE SAYING.
So where do I see the current trend? First, according to IBD, the put/call ratio was 1.19 on Friday. Readings above 1.00 indicate that options players are placing more bets on a decline, a major contrary indicator suggestive of at least a short term bounce up. Second, the media pundits are openly bearish and talk of an economic depression is creeping into their gossip. Third, the percentage of market bloggers bearish in a sentiment poll I participate in has tripled, to over 60%. And finally, we are entering the strongest (bullish)seasonal period in the markets. Given all of the above and the weekly chart of the QQQQ above, I remain mainly in cash and short the QQQQ in the QID. But I am ready to reverse my stance immediately if this market starts up. The market will climb a wall of skepticism and it does not pay to marry a particular market scenario….
I love market declines because it is much easier to identify the next leaders. Stocks that can remain close to their yearly highs or even break into new high territory in the recent market environment may be among the new leaders when the market turns. So, I used TC2007 to scan the market for new highs on Friday and looked at the fundamental and technical data to select some possible winners for my watchlist. These stocks hit new highs on Friday and had recent quarterly earnings increases of 100% or more: BITI and ATRO. These stocks hit new highs and had recent quarterly revenue increases of 25% or more: CSIQ, FCN, ATRO, EHTH, VMSI and ACO. If we get a year end rally, these technically strong stocks with strong fundamentals may be where I look to place my bets. Clearly, others (insiders?) are already accumulating them…..
Identifitying New Market Leaders
Trend: Stocks that remain strong during a correction are likely to be the next market leaders . Dr. Eric Wish at the Wishing Wealth blog describes how he identifies the next group of market leaders. Link: Wishing Wealth: GMI:1;GMI-R:1; QQQQ bounce off …
Thanks for the update. I enjoy reading your blog.