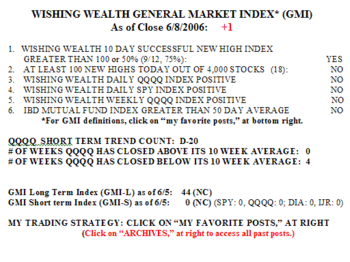
The GMI remains at +1, with 75% of the 12 stocks that hit a new high ten days ago closing higher on Thursday than they closed ten days earlier.  But my other five indicators remain firmly in negative territiory. There were 18 new yearly highs and 202 new lows in my universe of nearly 4,000 stocks on Thursday. Only 29% of the Nasdaq 100 stocks advanced, compared with 50% of the S&P 500 and 57% of the Dow 30 stocks. Thursday was the twentieth day of the current short term QQQQ down-trend (D-20).
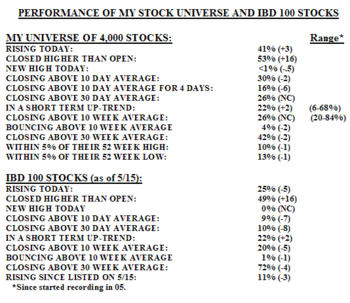
The weakness in the Nasdaq 100 tech stocks was mirrored in the IBD 100 stocks.  While 41% of my universe of stocks rose on Thursday, only 25% of the IBD 100 stocks advanced. Only 9% of the IBD 100 stocks closed above their 10 day averages, while 30% of my stock universe did. Only 10% of the IBD 100 stocks closed above their 30 day averages, compared with 26% of my universe of stocks. Perhaps the most telling statistic is that only 11% of the IBD 100 list published on 5/15 closed higher on Thursday than they did on 5/15….
I remain in cash or short in my IRA via put options. Rather than trying to guess a short term bottom, a true technician waits for the turn to occur as shown by his technical indicators. I will need to see a rise in the GMI to at least +3 before I will wade into stocks on the long side. Meanwhile, with a down trend in place, every rally offers a chance to increase my short positions.
Why are human beings so prone to the long side? Expert traders seize upon movement, up or down. As the great trader, Jesse Livermore, said, there is no bull side or bear side, only the right side— of the trend.
Please send your comments to: silentknight@wishingwealthblog.com.