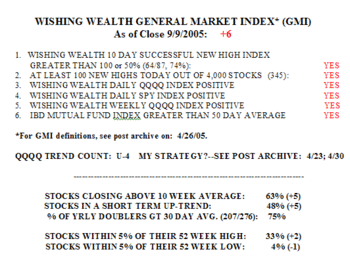
The market closed the week strong with the GMI at a max +6. This blog has helped me to systematize my trading and stay with the market. By focusing on the GMI and ignoring everyone’s opinions I have been able to remain with the market’s trend. One must trade with "what is" and not what I think or hope should be. As I have written before, if a truck is bearing down on me, it makes no sense to question whether it should be there or heading in my direction. I must react quickly to what is happening. 
I added a new indicator to the GMI table–% of yearly doublers greater than their 30 day averages. This indicator tracks the technical strength of all stocks in my universe of 4,000 that have doubled in the past year and traded at least 10,000 shares on that day. This indicator will tell me when the past year’s leaders are weakening, at least short term. Weakness in the market leaders often times precedes general market weakness. The list of doublers will be recalculated at each day’s close by TC2005, according to the criteria I mentioned above. The total number of doublers in the past year will therefore also provide an indication of the strength of the market. As of Friday, 75% of the 276 doublers closed above their 30 day averages.
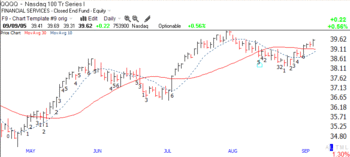
As I noted above, the GMI has helped me to stay with the market trend.  This chart (click on to enlarge) shows the changes in the GMI since I started posting it in April. Note that the GMI remained at +6 from the beginning of the rise on July 8 until August 16, and then declined with the market. The GMI returned to +6 on September 6 . You can judge for yourself whether The GMI has been useful for detecting meaningful changes in the market’s trends. Note in the chart that the 10 day average (dotted line) is about to cross above the 30 day average (red line). This would be another confirmation of a rising trend in the QQQQ.
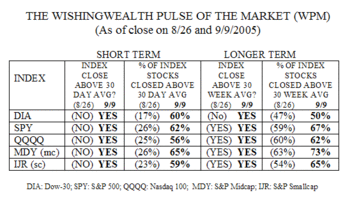
But the strength is not limited to the QQQQ. The WPM has strengthened considerably since I last updated it on 8/26.  All 5 indexes are now above their 30 day and 30 week averages. The DIA had given a false signal when it closed below its 30 week average for 2 weeks. Major increases have occurred in the percentage of stocks closing above their 30 day averages, with the range being 56%-65%, up from 17%-26%. The majority of the stocks in all of these indexes are now in short term up-trends. The percentage of stocks closing above their 30 week averages also increased, to 50%-73%. Midcap stocks in the MDY appear to be the strongest group of stocks–short and longer term. (Sometimes I think I should only trade these index ETF’s.)
This strength in the market in the midst of post-Katrina anxiety and general pessimism about the economy is to me a screaming buy signal. So I have committed most of my resources to the long side of the market. I have to ignore my emotional tendencies and stay with what the market is doing. As I begin to trust my indicators more and more, it has become easier to remain consistent with them and to tune out all other influences. As you know, I am a chicken and will jettison all of my long holdings when my indicators detect market weakness.
Will GOOG burst through $300 this week?
Please send me your feedback at: silentknight@wishingwealthblog.com.