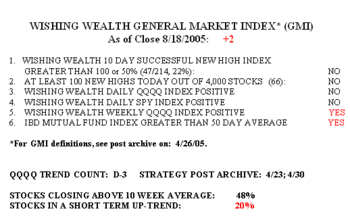
The GMI declined to +2 on Thursday as my short term indicators turned bearish.  There were only 66 new yearly highs and 47 successful 10 day highs. For now, buying stocks at new highs is a high risk strategy. The daily QQQQ and SPY indexes are now negative. We are therefore in day 3 of the QQQQ decline (D-3). Less than one half (48%) of the stocks in my universe of 4,000 stocks closed above their 10 week averages and the percentage of stocks in a short term up trend declined to a new low of 20%. As long as the remaining 2 indicators remain positive, I consider the market to be in a short term decline. I hold only put options and cash in my IRA.
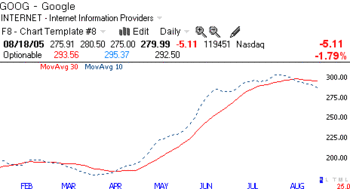
As you know, with the announcement Thursday of plans to issue more stock, GOOG declined again. Could we have anticipated this bearish reaction? I am posting an updated "Naked Chart" of the type I posted on 8/14. I wrote on 8/14:
"In my previous post, I showed you a "Naked Chart" of GOOG displaying the 10 and 30 day averages without the prices. It was clear that the up trend in a stock (GOOG as an example) was clearly shown by the 10 day average’s being consistently above the 30 day average. Well, over the past 2 weeks many of the leading stocks, including GOOG, have shown a negative cross-over with the 10 day average now being below the 30 day average."
Here is GOOG’s chart as of Thursday’s close.  For the first time since the stock rallied in April, its 10 day average remains consistently below its 30 day average. The lesson to be learned for me is: Do not buy or hold any stock where its 10 day average is consistently below its 30 day average. Such stocks are my short candidates, especially after a long period where the 10 day was above the 30 day, as in GOOG.
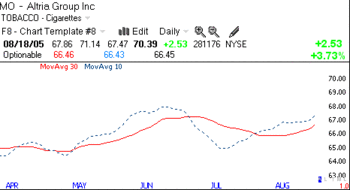
MO rallied sharply Thursday on a favorable court judgment. Could we have spotted the reversal in trend days before the news came out? You be the judge. ……………………………. 
Please send me your feedback at: silentknight@wishingwealthblog.com.