“Want to know how to make a small fortune in the stock market?
Start with a large fortune!”
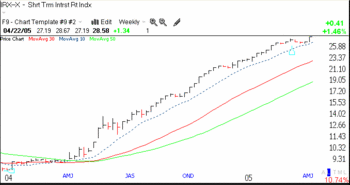
I thought you would probably want me to back off of the strategy discussion (see yesterday’s post) and to return to my take on the market. A number of people have written to me about going short. This interest, together with the skepticism about the market’s rally in the media cause me to pause, just a little. However, I do not reverse direction until my market indicators start to change. So, I wait, mainly in cash and put options in my IRA. (I did sell my one small long position, MHS–I got tired of holding anything at odds with the general market trend.) The attached chart (click on it to enlarge)  shows the consistent rising trend in short term interest rates that started in May, 2004. (I have asked the TC2005 support staff at Worden.com to tell me the basis for this index, and will report back on their answer.) The Fed’s persistent pressure on rates is one of the obstacles to a rising market. Historically, in its fear of inflation, the Fed typically misjudges how much to put on the brakes and eventually brings the market and the economy to a screeching halt. (In spite of this track record, traders tend to delude themselves into thinking that this time will be different and we will get a “soft landing.”) This short term interest rate index has been hugging its rising 10 week moving average for months, and just bounced off of the average to a new high, after a few weeks of a plateau. This renewed rise is not a good omen. A consistent reversal in this index will probably foreshadow a subsequent bottom in the market–but not immediately. So, we will keep an eye on this index.
IBD’s Monday edition published a put/call ratio of .86. This means that 86 puts were traded for every 100 calls. (Puts are options that gain when the underlying security falls; calls gain as a security rises. In other words, puts are bets by option traders that a security will fall, calls are bets on a rise. Did I imply that people are gambling?) This ratio is a contrarian indicator, which means that it typically predicts the opposite type of market movement than would be expected from the trades. If an extremely high number of option traders are bearish (buying more puts than calls) then the market often tends to rise, at least short term. People are most scared at bottoms and overly optimistic at tops. Most of the time, traders are more bullish than bearish and the p/c ratio is below .80. When it stays above .80 for a while and gets above 1.0, the market usually is in store for a bounce. The current ratio is not at an extreme. However, if it breaks 1.0 this week it may signal short term strength in the market. If the P/C ratio starts to trend lower in this depressing environment, say below .60, watch out below!
I am short some housing stocks. It is rare that I find so many companies in an industry with the charts looking so sick. Here are a few, in no special order: RYL,OHB,LR,LEN,MDC,MHO,DHOM,WCI,SPF,DHI. I did not run out of ugly symbols, but you get the picture. Even lofty NVR appears to have broken its uptrend on a number of large volume declines. Is it too late to sell these? Who knows, but the current trend is obvious to me. Could insiders possibly be showing us something about the future of housing? Watch behavior, not words.
I hope you have a good trading day tomorrow. The trend is your friend.
WishingWealth 10 day successful new high index: 4/22 19; 4/21 28; 4/20 12 (for definition, see Madness post)