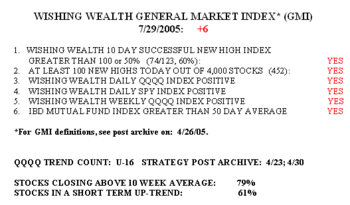
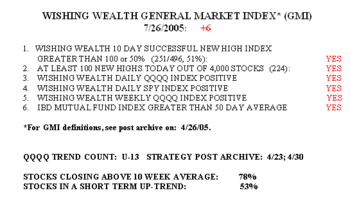
Well, it did not take long to see where all of this short term weakness is headed. I said in my post on Sunday night that during my 2 week vacation my short term market indicators had weakened considerably. And now, as of Tuesday’s close, only 27% of the stocks in my universe are in a short term up-trend, down from 61% on 7/29, and 68% at the peak on 7/14. This indicator had never fallen below 40% since I started tracking it at the end of June. At the bottom of the QQQQ decline on July 7, this indicator registered 48%. In other words, the market weakness we are seeing now– near the beginning of a decline– is greater than we saw at the end of the previous decline–something to ponder.
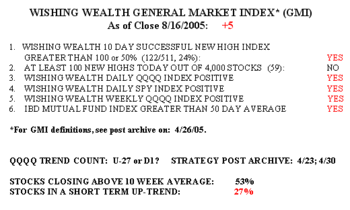 The GMI declined Tuesday because there were only 59 new yearly highs. While there were 122 successful 10 day new highs, this represented only 24% of all of the 511 stocks (in my universe of 4,000) that hit new highs 10 days ago. Clearly, buying stocks at new highs 10 days ago has not worked out well, if one held on to them. My favorite gurus (see Boik’s book at right) have written that when stocks breaking to new highs fail, it portends general market weakness–as if we need more evidence. There were 28 new lows Tuesday, highest since July 7. Only 8% of the Nasdaq 100 and S&P 500 stocks advanced , along with 13% (4) of the Dow 30. Only 53% of stocks closed above their 10 week averages, down from 83% on July 20………………………
Cramer committed hara-kiri (I looked it up!) Tuesday night over his recommendation on DKS, which fell 16%. He also fessed up to recommending ANF (-3.65%). I give him a lot of credit. How many of the talking heads ever come back quickly to discuss their ill founded advice? However, I think Cramer exemplifies the hazards of eschewing charting and technical analysis. If one makes his decisions based solely on earnings, industries and assessments of economic trends, one can get trapped in losing situations. I hate to be a told-you-so, (no I don’t) but if Cramer had been following my rule of not buying stocks when their 10 day average is below their 30 day average, he and his followers could have avoided this catastrophe. 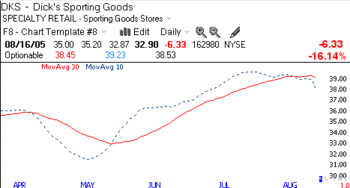 This "Naked Chart" shows that DKS had a negative crossover of its moving averages last Wednesday. Moreover, the QQQQ has been weakening for several days (8 straight closes below its 10 day average) and he should have been raising cash and becoming defensive, rather than recommending new purchases. Last night, Cramer’s only rec was Wachovia Bank (WB), because it is boring and pays a dividend. Technically, it looks sick to me……………….
LUFK and BBY both had failed bounces and I was stopped out of them Tuesday with small losses. I love to buy on a bounce and place a sell stop just below the bounce. I end up with very small losses when I am wrong. But my puts made $$ yesterday. Stocks I mentioned in my prior post weakened nicely, including HD, the QQQQ ETF and housing stocks. Even GM is slowly tanking–wonder why? I have only one long, FTO, and I suspect I will be stopped out today. Isn’t it interesting that even oil stocks declined Tuesday. People don’t use as much oil in a weakened economy. And the people I have talked to seem to be increasingly reacting to the high gasoline prices. Ask folks around you. We will probably see the negative economic effects first in the retailers like WMT, which caters to customers at the lower socioeconomic levels, but the higher oil prices may affect more of us in the coming winter when we get our heating bills. Maybe we should expect a polar bear market?
I don’t want to appear too bearish. Only my short term indicators are weak. I have no reason to suspect a longer term decline–yet. Another down day today will reduce the GMI two more points, to 3. It would have to go all the way to zero for me to become really bearish. For now I will simply ride this short term decline.
Please send me your feedback at: silentknight@wishingwealthblog.com.
