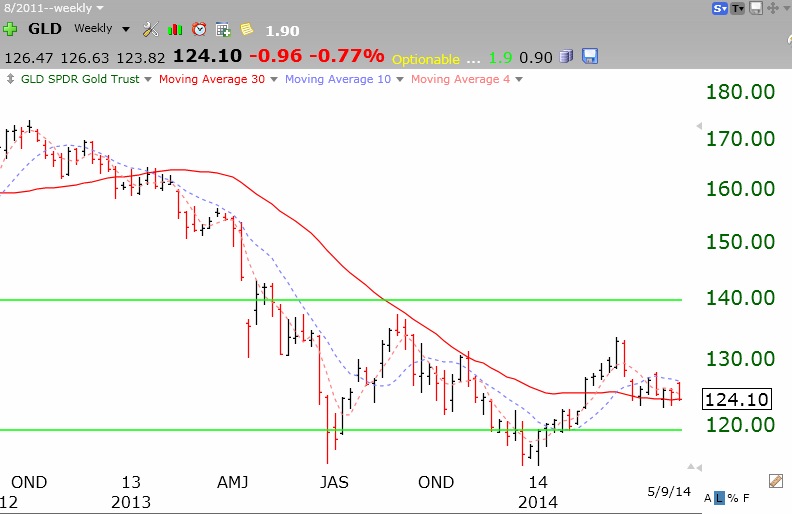
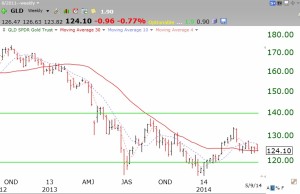
I have not talked about gold for quite a while. This weekly chart shows that after the huge Stage 4 decline from the top through most of 2013, GLD has formed a double bottom (around $114) and is now building a classic Stage 1 base. Note that GLD is now resting upon its flat 30 week average (red line). If the 30 week average starts to curve up, signalling the onset of a a new Stage 2 up-trend, I will become interested in owning GLD again. I ignore the news and media pundits and rely on the price action to inform my trading decisions. (Click on chart to enlarge.)
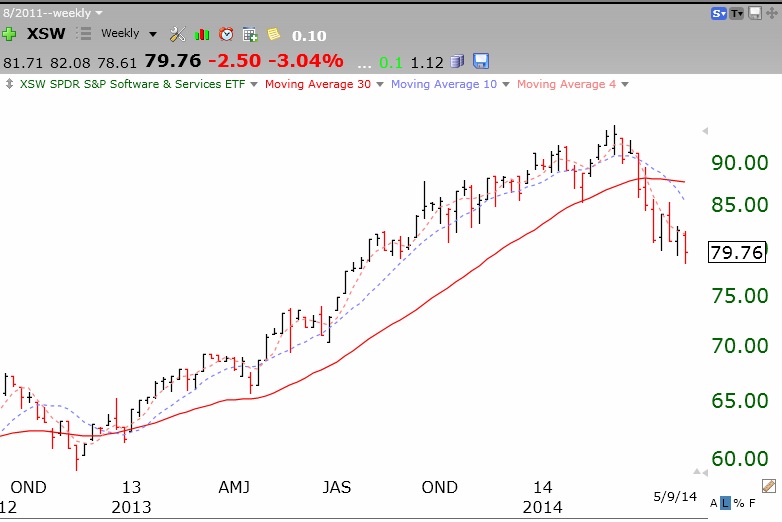
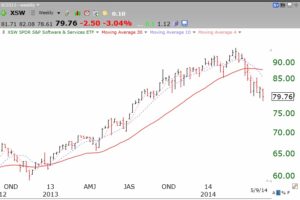
By the way, a sector with an ominous chart is software, measured by the ETF, XSW. The long Stage 2 up-trend is over and XSW may be entering a Stage 4 decline. Compare XSW’s chart to that of GLD about one year ago. History does not exactly repeat–but it sure rhymes.
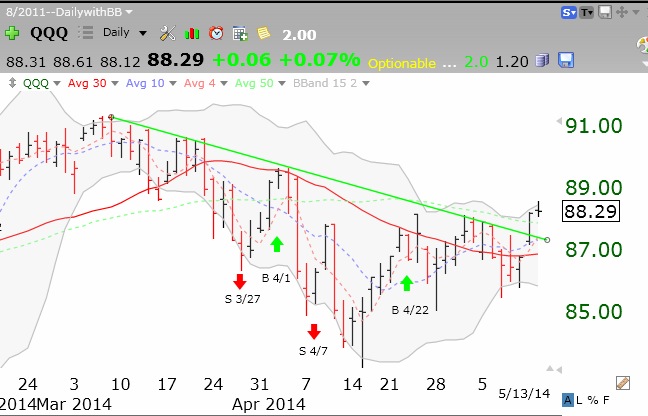
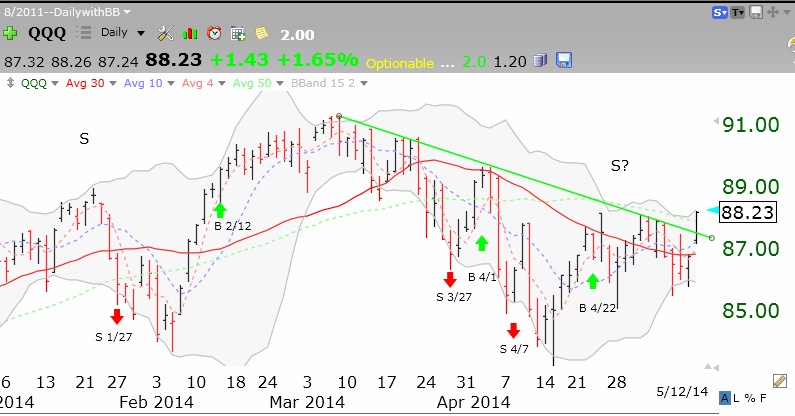
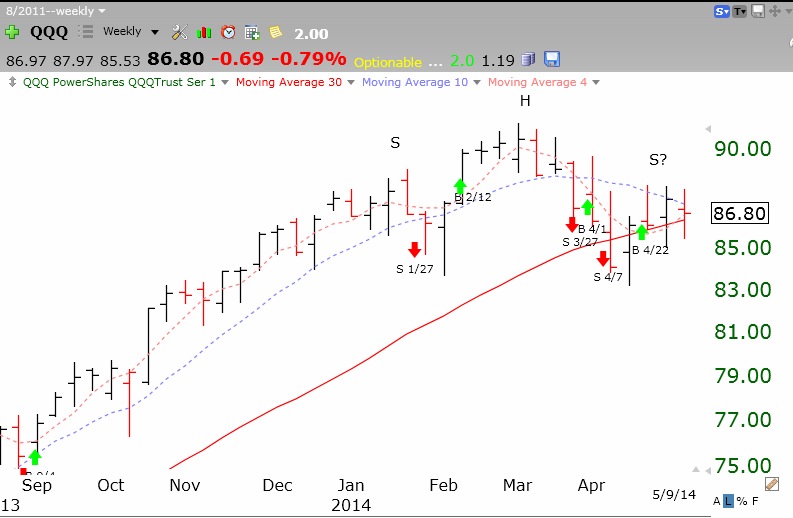
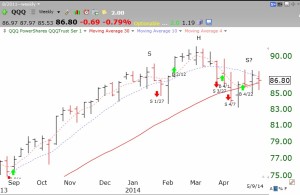
Finally, I alerted you recently to a possible head and shoulders top formation in the QQQ. As this weekly chart shows, the right shoulder (noted by the S?) may have formed. Note also that the QQQ is resting on its critical 30 week average (red line). We need to watch this pattern very carefully because a break of support would likely result in a significant decline. Furthermore, it is quite evident from the chart that QQQ has returned to the same level at which it began 2014. That is a long time for this important index ETF to tread water. Market tops typically take a while to form….
Given this malaise in tech stocks, it is noteworthy that the GMI is at 2 (of 6). The more sensitive GMI2 is at 2 (of 8). The market is still split with the SPY closing above its 10 week average for 4 weeks while the QQQ has closed below its 10 week average for 7 weeks. With IBD still calling the market in a correction, this is the time for me to be defensive and to take minimal risks.