This bounce looks weak to me but the GMI is back to 6. I am still somewhat skeptical. I do not trust changes in the short term trend until they last 5 days. The short term down-trend that just ended lasted only 3 days. Longer term up-trend remains in place.
3rd day of $QQQ short term down-trend
A lot of stocks bounced from oversold on Wednesday. Another up or flat day will change the QQQ short term trend to an up-trend. The longer term trend remains up. Interest rates continue to rise.
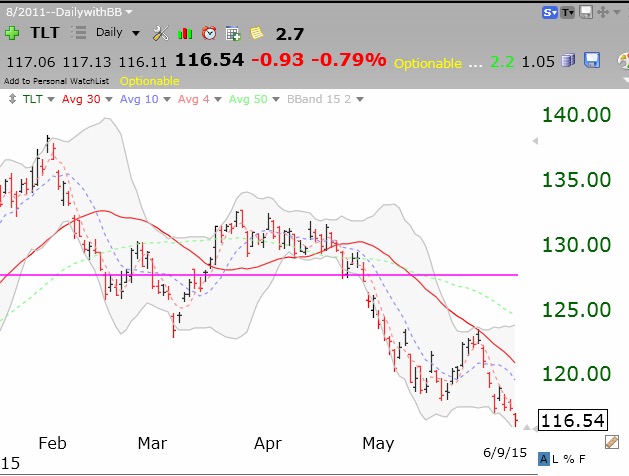
2nd day of $QQQ short term down-trend; $TLT falling as interest rates rise
Indexes are oversold and should bounce. However, P/C ratio is only .89. This market may have to decline further. Bonds are in a free fall as interest rates move higher. Check out the 20 year treasury bond ETF, TLT.