Speaking at DC Metro AAII meeting on 7/13; Indexes in daily RWB up-trends
Next Saturday I will be offering a workshop at the local AAII. You can access information here. It has been two years since my last appearance for AAII. This presentation will differ from my previous ones because it will also focus on investing in ETFs rather than just growth stocks. As I get closer to retirement, I have become more conservative in my trading and tend to focus on index ETFs. I hope to meet many of my readers next weekend…..
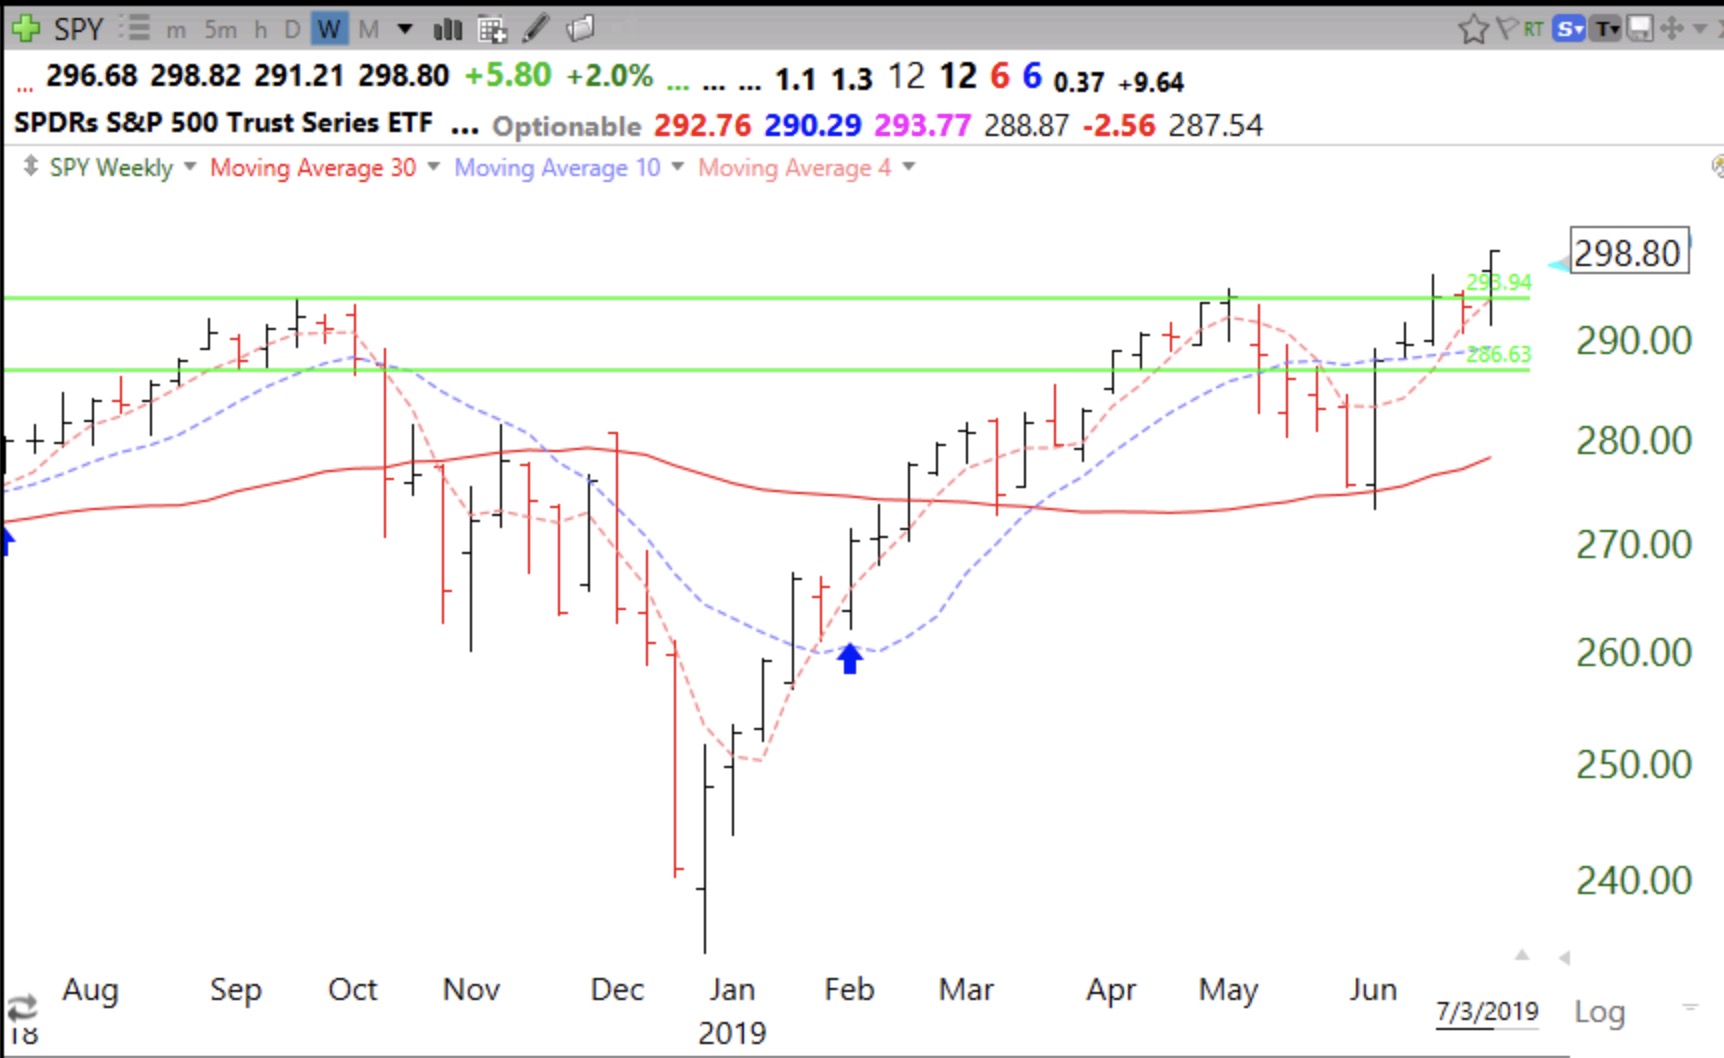
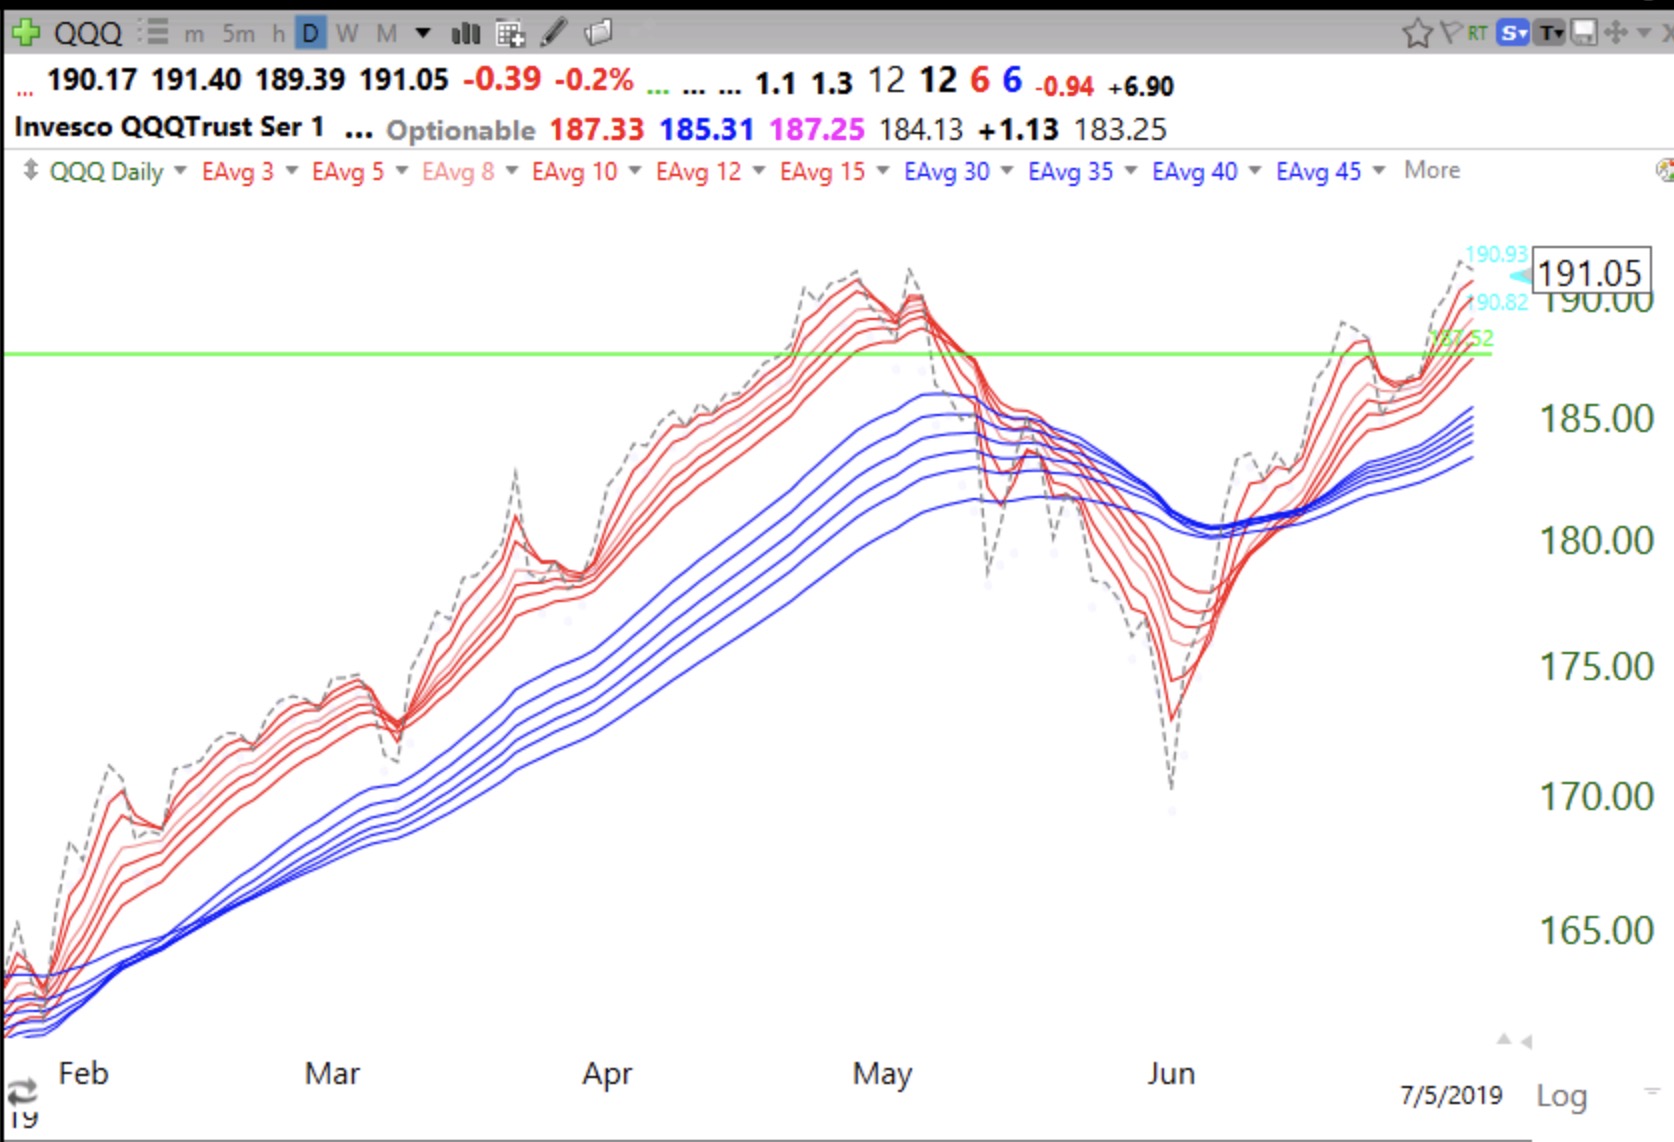
QQQ, SPY and DIA remain in daily RWB up-trends. Once an RWB pattern develops it is impossible to know how long it will last. So I pyramid up and ride it until it fades. Note how often the index closes (dotted line) above all 12 averages.
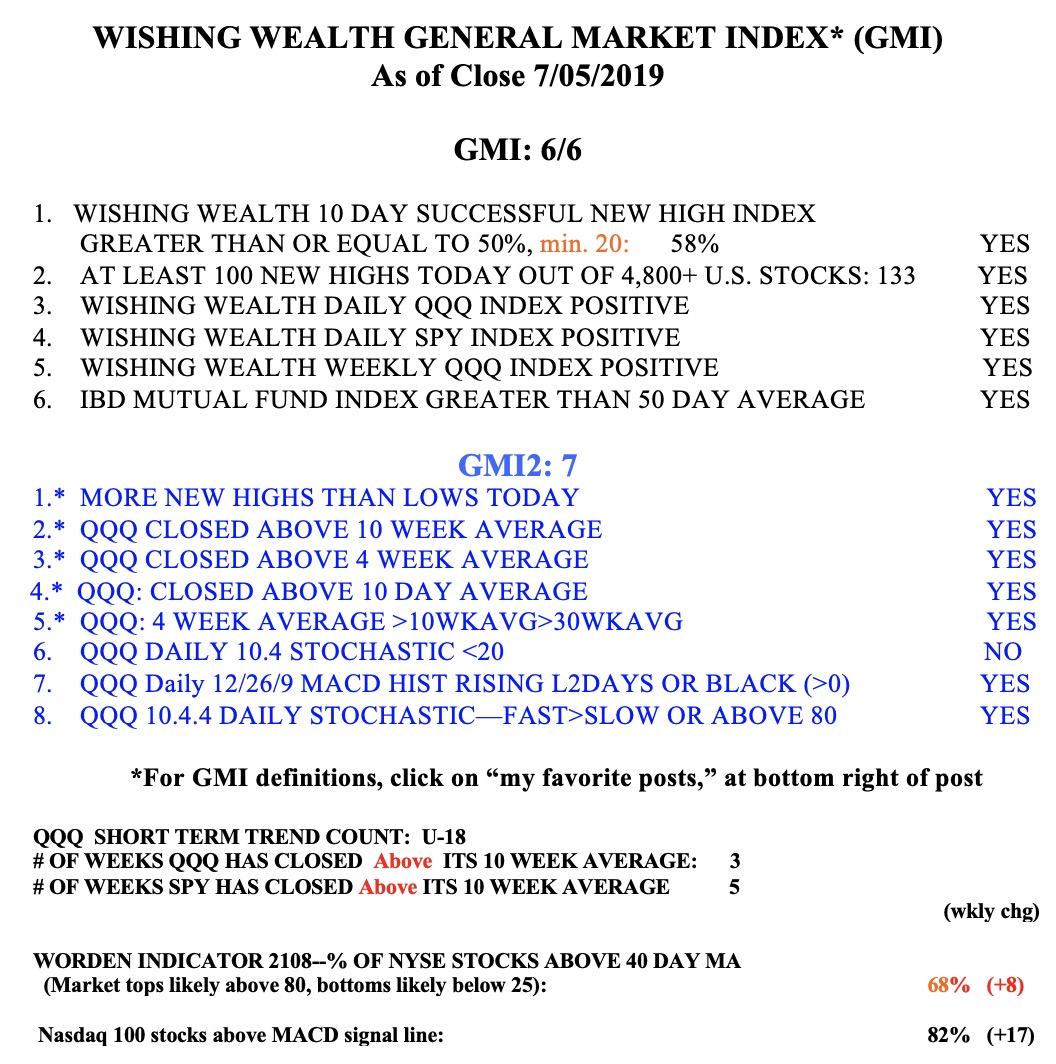
The GMI remains Green at 6 (of 6).