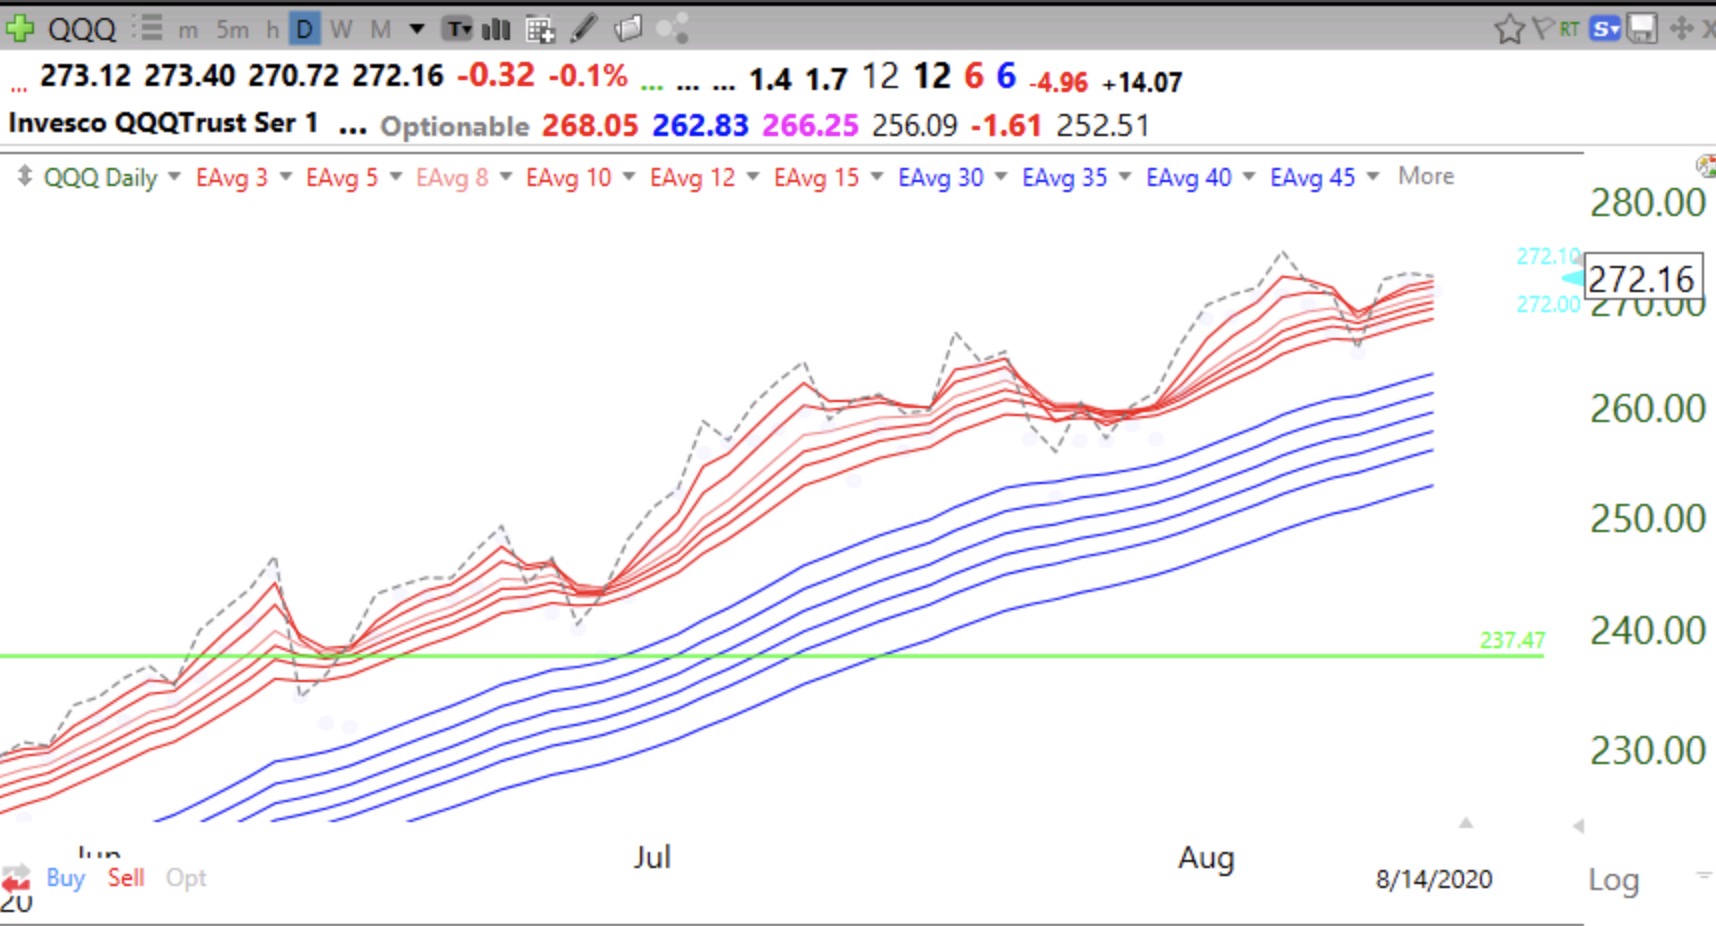
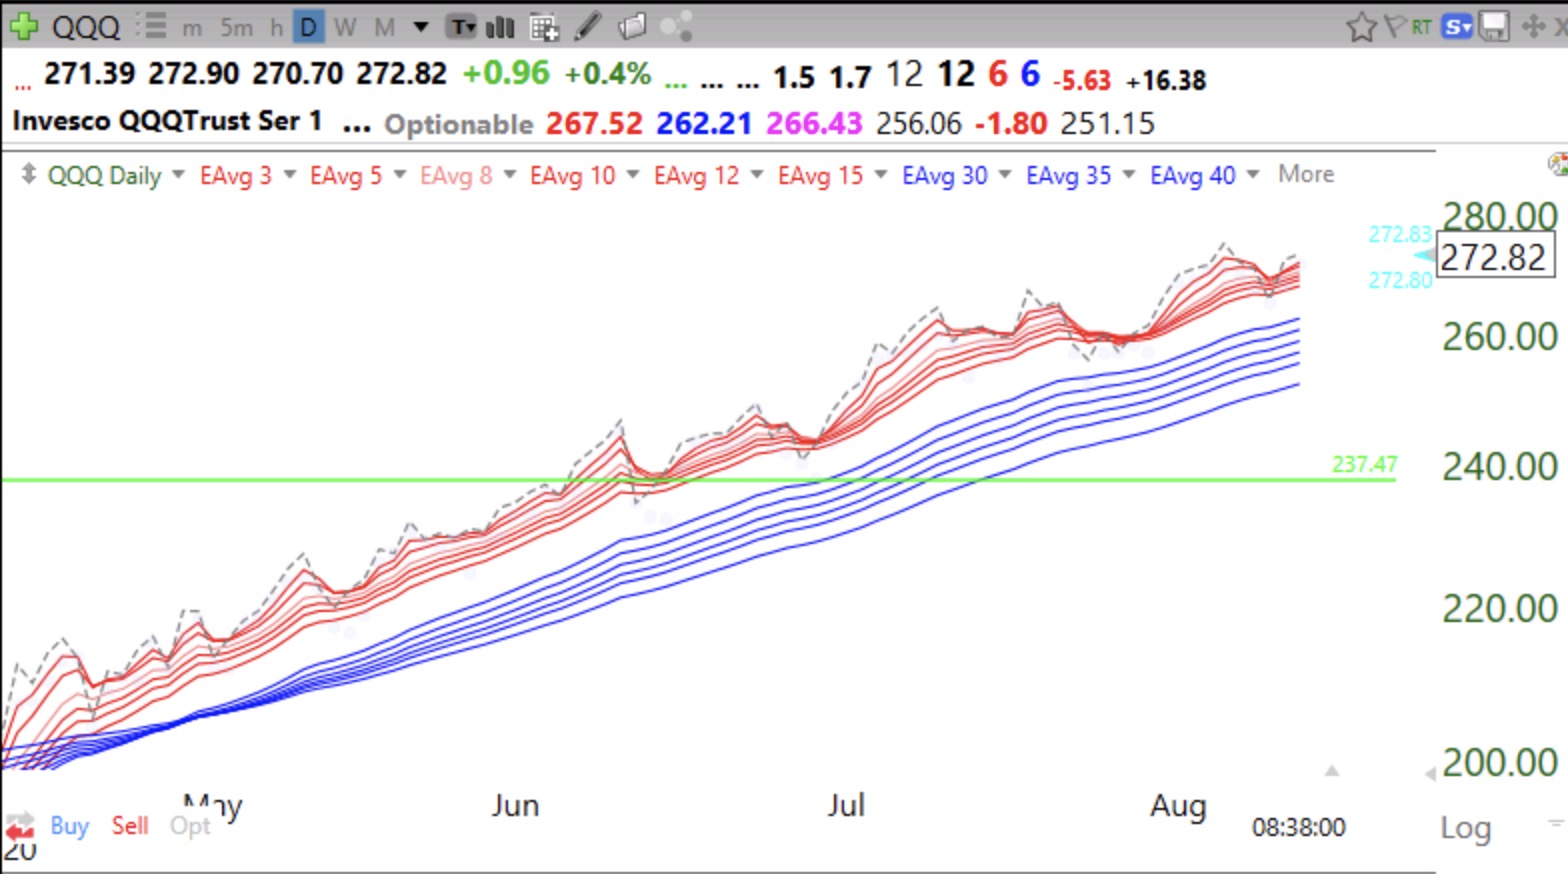
Buying stocks at new highs has been a difficult strategy lately. Thursday and Friday fewer than 100 US stocks hit new highs, compared with 100-200+ in many days in July. Last January we had 409 stocks at new highs. Some market indexes though near record highs, do not reflect how many stocks are performing. On 3 of the last 5 days last week fewer than 50% of the NASDAQ 100 stocks rose. However, this daily RWB chart shows that the QQQ has still closed (dotted line) above all 12 averages. Put/call ratios are very low and sentiment is quite bullish, both contrary indicators. Being a chicken, I am still content to be on the sidelines for a while.