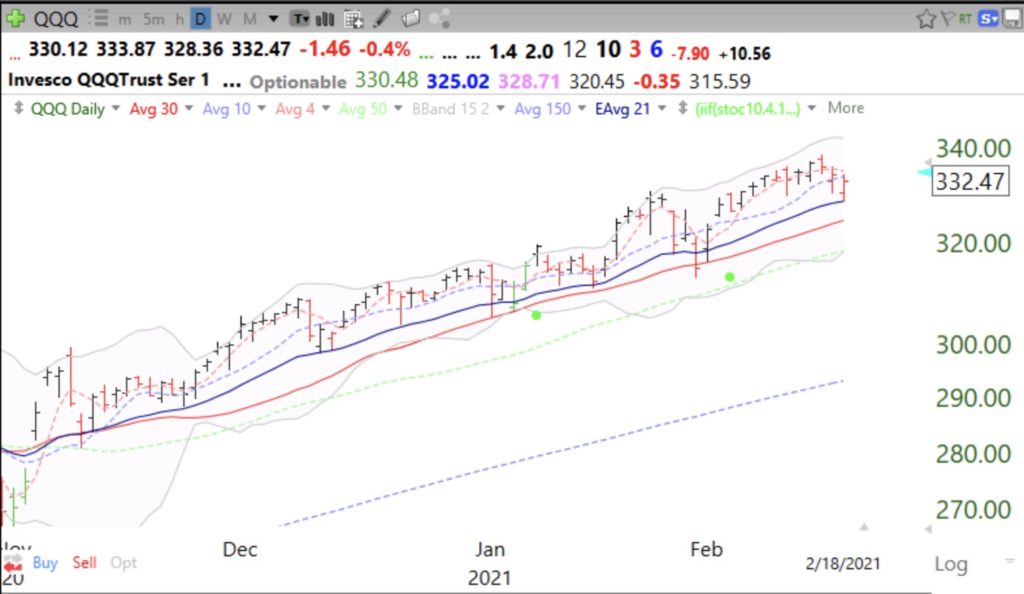
$QQQ now has rising 4WK>10WK>30WK Averages –first time since February, signifying strong up-trend; Worden T2108 approaches 90%

GMI5/6
GMI-27/9
T210887%

Weekly chart, 4wk=pink dotted line, 10 wk=purple dotted line, 30 wk=red solid line.

A note of caution, the Worden T2108 indicator from TC2000 is approaching 90%, indicating that almost all NYSE stocks are now above their 40 day simple moving average of price. While not a foolproof indicator of overbought and impending weakness, it bears watching. I post T2108 each day.

Note my mantra to back up the truck and buy a market index when T2108 is in single digits worked again. If only I had the courage to follow my own advice when that happens, which occurs when everything looks frightening. It takes real fear and an unexpected event to bring T2108 into single digits. T2108 stayed around 2% for 3 weeks in March, 2020. As the famous quote about his market success goes,  “I buy when the blood is running in the streets.”