The QQQQ remains in a nice up-trend and I am long stocks. We are in the period when few pundits believe the rally is justified. That is okay with me. I just ride the train as it goes in the right direction, until it turns. Two stocks I have been riding, PEGA and SXCI, have had nice break-outs. However, I still prefer to concentrate in the ultra QQQQ ETF, QLD.
T2108 about as high as it gets–time to hold off on new buys? Oil and gas at bottom?
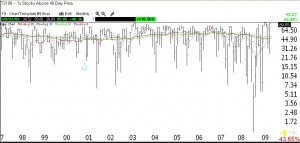
I am a little concerned that the Worden T2108 Indicator is at 90%, about as high as it gets. It measures the percentage of NYSE stocks above their 40 day simple moving average. See weekly chart of T2108 below. (Click on chart to enlarge.) It may be time for me to hold off on new purchases. However, the GMI is now 6 of 6. I am therefore almost 100% long, as the longer term trends remain up. I am also watching the ETF’s UNG and USO, as gas and oil may have bottomed.
Up-trend in place; Time to be long; 9 IBD100 stocks at new highs
The market up-trend is in place and I am almost 100% invested on the long side in my trading IRA. I am also largely invested in mutual funds in my university pension. This is the time to ride the train and not to fight it. No one knows when the up-trend will end. The idea is to ride it and have sufficient stop losses in place to exit if the trend should convincingly reverse. The GMI is at 5 of 6, having been at 6 at Thursday’s close. There were less than 100 new highs (74) in my universe of 4,000 stocks on Friday, bringing it down to 5. I suspect we will be back to 6 this week. Meanwhile, 84% of the Nasdaq 100 stocks had their MACD close above its signal line, a nice show of strength. The Worden T2108 Indicator is at 88%, near the top of the range it typically reaches. But it can stay above 80% for months.
