Dow up-trend looks real

GMI6/6
GMI-R10/10
T210884%

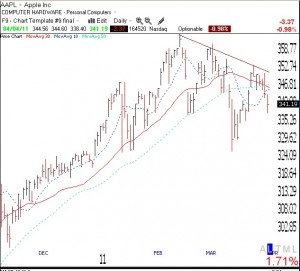
The GMI is now at 6 (of 6) and the GMI-R is 10 (of 10).   The daily GMMA chart of the Dow below (click on chart to enlarge) shows that all short term averages (black) are now above the longer term averages (red).   Time for me to wade slowly back into this market.   Getting ready to sell out my UNG if it declines below 7.80 on Tuesday.

Successful Saturday AAIA presentation; UNG bottoming?

GMI5/6
GMI-R9/10
T210879%

On Saturday, I had the honor of speaking before the Virginia AAII Computerized Investing SIG.   I spoke about my technical analysis course at the University of Maryland and my trading strategy.   I presented a lot of material which I included in my Worden webinar.   For those who missed Saturday’s session or would like to review my material, please go to www.worden.com and scroll down to the webinar, “A word from the professor.”   I think that Saturday’s   session went well and I was pleased to see that most attendees said they would enroll in a future workshop, if I should arrange one. If anyone who was there would like my oversold stochastic followed by a buy signal PCF, please email me at:   silenknight@wishingwealthblog.com

Meanwhile, the GMI is still at 5 (of 6), with only my Weekly QQQQ trend indicator remaining negative. The short term trend of the QQQQ remains up and has just passed its 6th day.   The QQQQ and SPY   ETF’s have closed above their critical 10 week averages for two weeks.   I tend to make money trading on the long side only when these indexes close above their 10 week averages.   The Worden T2108 Indicator is at 79%, near overbought territory, where it can often remain for months. Finally, 73% of the Nasdaq 100 stocks have a MACD above its signal line, a sign of near term strength.

With the Weekly QQQQ Index still negative, I am reticent to commit to the long side of the market.   I therefore remain heavily in cash.   However, as I wrote on Friday, I think that UNG may be bottoming   and I have a long position in this natural gas ETF.   I usually only buy stocks at all-time highs.   Commodities are different, however, because they have a true value.   Natural gas is not likely to go to zero.   I therefore think that commodities go back and forth between oversold and overbought. Since UNG seems to me to be forming a bottom after a tremendous decline, I am willing to place a small bullish bet on it.   It recently gave me a buy signal after hitting extreme lows on its stochastic indicator. If I am right and UNG continues to strengthen, I will add to my position.   Below is a monthly chart of UNG. (click on chart to enlarge.)   UNG has closed above its 5 month moving average (dotted line) for the first time since the decline began in July, 2008.

GMI back to 5; QQQQ short term up-trend completes 5th day; UNG

GMI5/6
GMI-R9/10
T210878%

The GMI rose back to 5 (of 6); there were 102 new 52 week highs in my universe of 4,000 stocks on Thursday.   While my longer term indicators remain down, this short term rally in the Nasdaq 100 stocks (QQQQ) is still intact, having lasted five days.   I am beginning to look at the natural gas ETF   (UNG) again and have taken a small long position because it looks to me like it has bottomed.   UNG has not confirmed a new longer term up-trend, however.   (A close above 8.26, its 30 week average, would be quite bullish.) But since it is a valued commodity, I do not see much chance that it will fall to zero!   UNG gave me a short term buy signal when its stochastic became oversold and then UNG closed back above its key 30 day average.   If UNG declines back below this average, currently 7.84,   I will sell my position.

———————————-

For those of you who are first time readers, welcome!   I want you to know that I write this blog to share my experiences gained from trading over more than 40 years. I also write this blog to educate my students at the University of Maryland, who are enrolled in my classes on technical analysis of stocks.   I am passionately committed to educating people about trading because I believe that our education system has failed to prepare its citizens for their financial survival.   My students learn to greet assertions and   advice from the pundits in the financial media with a heavy dose of skepticism and their own critical analysis.

As a part-time trader, I have educated   myself through extensive reading of the works of successful traders and through analysis of my own trading performance.   I bring my training as a research psychologist to the subject of trading. I have been able to multiply my IRA 14x since 1995 and have been able to keep my university pension safely in cash during all of the major market declines since 1998, and to reinvest the funds in the subsequent advances. My university pension has been spared the scars and heavy losses from the declines in 2000-2002 and 2008.

I rely heavily upon my General Market Index (GMI) to keep me on the same side as the major market trend.   The GMI is a simple count of the six indicators that I use to gauge the market’s short and longer term   trends. I exit to cash when my indicators signal a major down-trend, usually when the GMI is below 3. I wade back into the market slowly when the GMI recovers. I do not predict the length of trends, I try only to ride them until they end. The few excellent books that made a difference to my trading are posted to the lower right of this blog, and most are required reading before my students are allowed to formulate trading rules and test them in a virtual trading exercise.   I compose each daily post after the market close, and publish it on Monday through Friday around 7:00 AM EST. While I publish the GMI reading every post, I present the GMI’s full components only on   Monday morning. I hope that readers will benefit from my experiences and apply whatever they find useful to their own trading.   I am empowered by your comments and ask that you give me feedback in the comment section of each post, or send them to me via email at:   silentknight@wishingwealthblog.com.