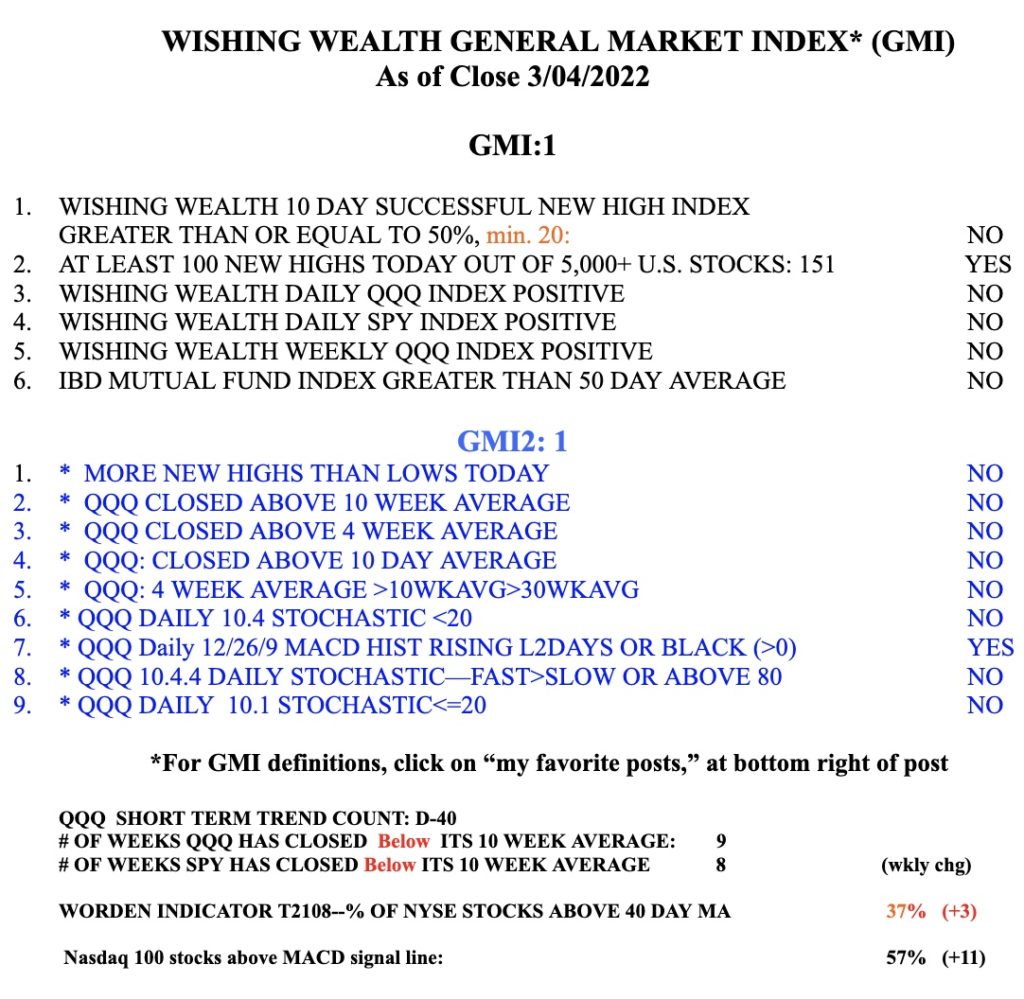
No one knows whether the market’s final bottom is in or if this is just a dead cat bounce. The major indexes are still below their declining 30 week averages. So the longer term trends are down but we now have a short term up-trend. A change in the short term trend is more tradable once it lasts 5 days. If the GMI can flash Green I may become more confident of this turn….
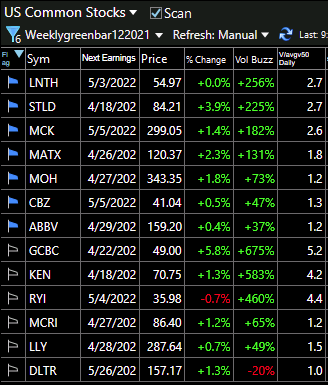
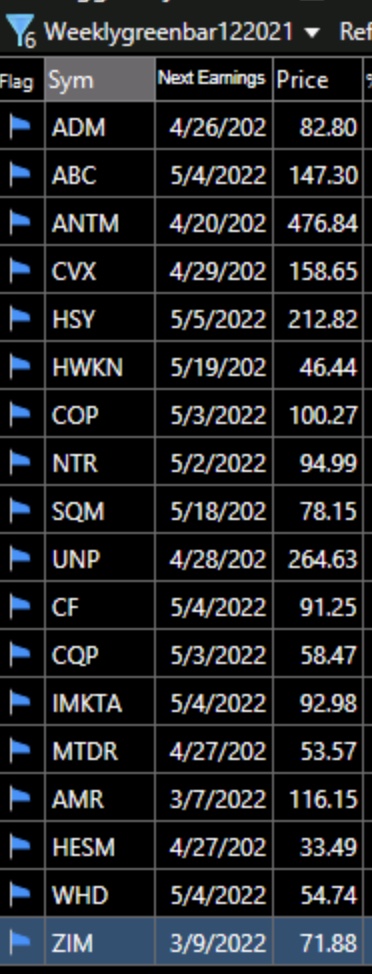
My TC2000 WeeklyGreenBar scan helps me find stocks trading at all-time highs that have strong relative strength and technical strength. I applied the scan to a watchlist of 483 stocks that have appeared on promising lists in IBD or MarketSmith in the past few months. Seven of those stocks passed this scan. When I scanned all 6.997 US stocks, it found another 6 stocks. In this table, the IBD/MarketSmith stocks have a blue flag. The last column shows Friday’s trading volume divided by the average volume the past 50 days. Some of these stocks may turn out to be true market leaders. I will monitor them. I have very small positions in a few of them in my trading IRA and remain 100% cash in my university pensions.
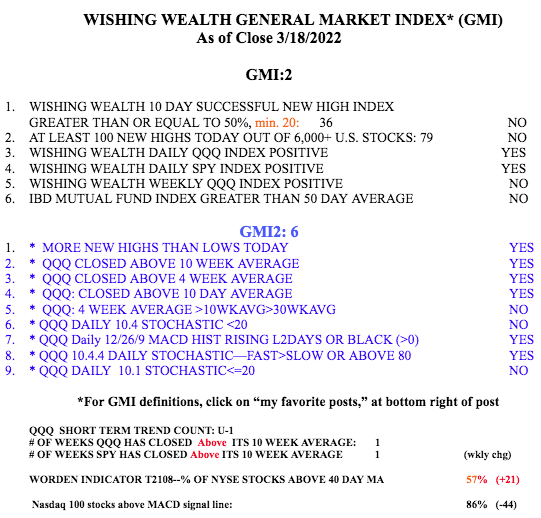
The GMI remains 2, of 6. When the GMI registers 4 or more for two consecutive days it will flash Green.
