As you know, I use the Worden TC2000 charting software daily to follow the market and to teach my university course on technical analysis. The Worden group has graciously invited me to speak at their seminar on Friday and Saturday. You can check out the agenda on their site. I hope to meet many of you there. If you can’t make it, I will post here when the session tapes are made available.
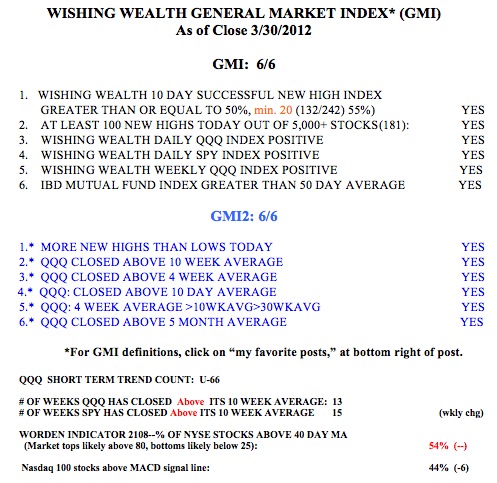
Meanwhile, the GMI is back to 6 (of 6) even though the futures indicate a rocky start on Monday. I am a little worried that last week, IBD labeled the market in a correction. 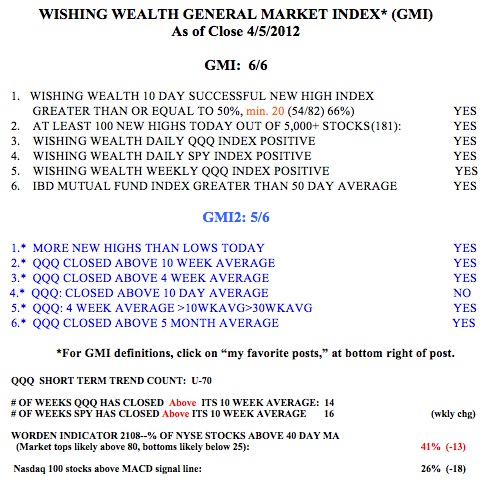 They have a very good track record on calling the market trend. I remain long, however, until the GMI shows major weakness. But I may cut back a little in the holdings in my trading account. The Worden T2108 Indicator remains at 41%, in neutral territory. By my count, Thursday was the 70th day of the current QQQ short term up-trend. This is quite long for an up-trend to continue. I am also concerned that only 26% of the Nasdaq 100 stocks closed with their daily MACD above its signal line. This indicates short term weakness.
I am not going to highlight promising technically strong stocks today, and will wait instead until the markets show more strength.