I think of the market action as being similar to a rubber band that is stretched to an extreme on the down-side or the up-side until a catalyst happens that releases it so that the market index snaps back towards the middle and then the process starts all over again. Thus, last week it was clear to me that the Nasdaq 100 index (ETF: QQQ) was very oversold and I therefore bought some QLD (the double long QQQ ETF) and protected it with a put in case I was wrong. I did not know that the FED or China or something else would be the catalyst that would cause the market to snap back from oversold territory, just that the market was stretched to an oversold extreme. And so I bought when maybe I normally would have been selling. If one can get out of the market near the top of a range and then wait for one of these oversold periods to re-enter on the long side–that is the key. Instead, I typically get caught riding the market down from a peak and then sell out exactly when I should be buying. But once I take my loss, I am in no mood to go long, as I lick my wounds. On the other hand, if I were out of the market during the decline and calmly waiting for the oversold bounce, I would be much more likely to try to enter on the long side at the first sign of a reversal. The biggest problem I and my students have is buying stocks that are extended or overbought and then selling exactly when they retrace and we should be buying.
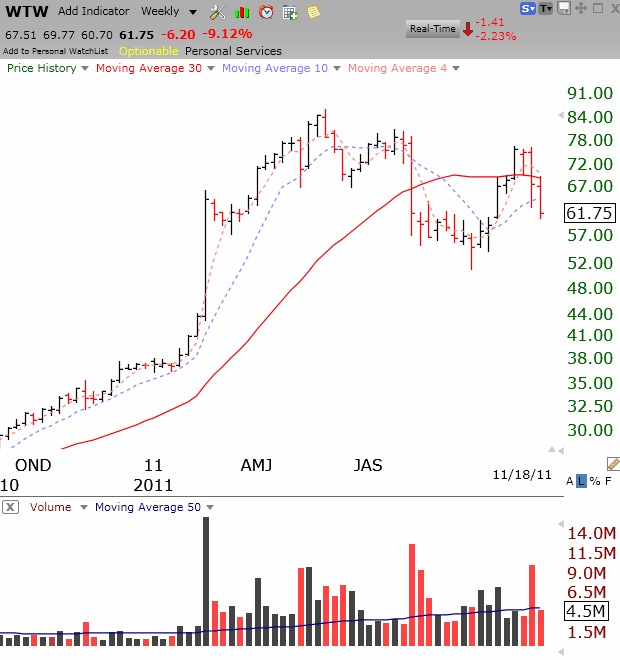
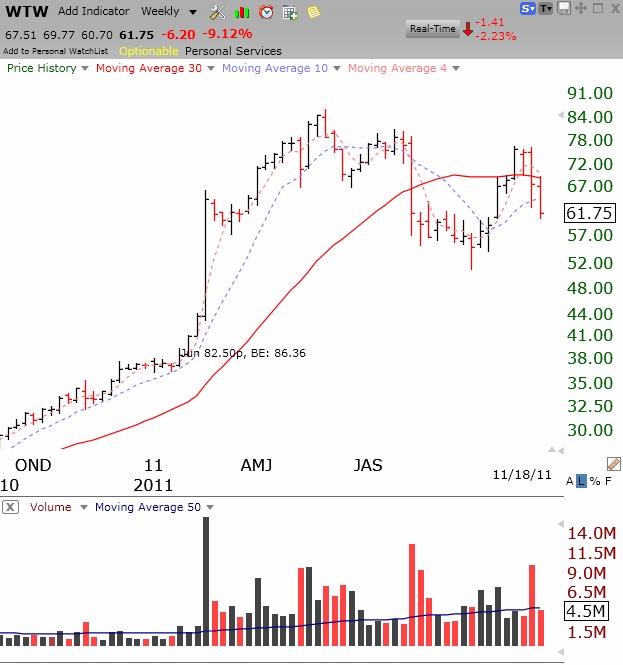
This is a major innovation in my trading. Instead of trying to enter equities when they break out, I seek to enter when an equity is in a weekly Stage 2 up-trend and has become oversold on the daily time frame. I go long and then place a stop (or buy a put) just below support in case the decline resumes. I use TC2000 to scan the market for such opportunities. There were plenty of bouncing oversold stocks when the market indexes were oversold. Now there are few. So I will wait patiently until the indexes become oversold again…….
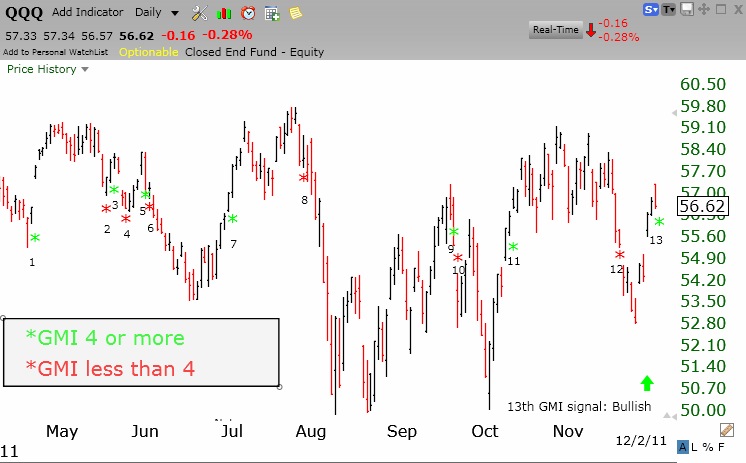
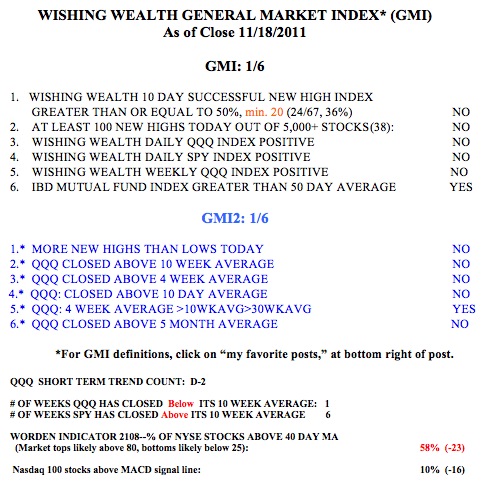
The market rebounded last week from a very oversold point. One never knows how far a rebound will go. 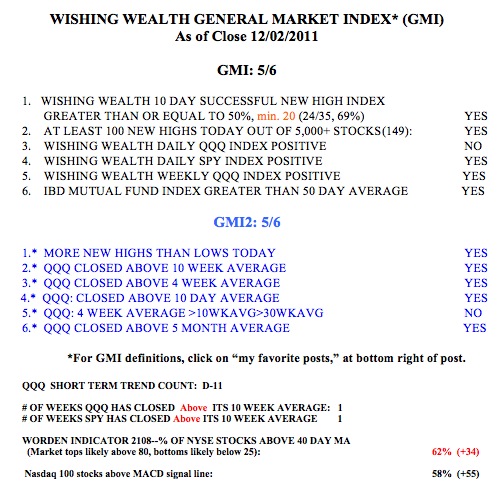 The key is to hold my QLD until there is a sign of a new decline or of an overbought point. Then I will sell the QLD or write a call option on it. Right now, the market does not appear to me to be overbought. While the GMI is 5, IBD still says that the market is in a correction. According to IBD’s methodology, there is no confirmed up-trend because there has been no high volume follow-through on this rally yet. And by my count the QQQ completed the 11th day of its short term down-trend on Friday. Nevertheless, as the daily chart of the QQQ below shows, the GMI flashed a new bullish signal (signal #13) on Thursday, using my new criterion (described in last Monday’s post) of needing 2 days with a GMI of at least 4 to signal a new up-trend. 58% of the Nasdaq 100 stocks closed with their MACD above its signal line, a sign of short term strength. Both the SPY and QQQ have now closed above their 10 week averages, a critical requirement for my trading profitably on the long side. The T2108 is at 62%, in neutral territory.
My stock buddy, Judy, told me recently she is focusing on stocks related to the transportation of liquified natural gas (LNG). The U.S. is apparently going to expand exporting LNG. Interestingly, my scan of 5,000 U.S. stocks looking for stocks with good fundamentals and hitting new highs on Friday yielded 19 stocks, of which 6 (!) are involved with natural gas: NGLS, OKS, FTI, OII, SE and WPZ. Maybe Judy is onto something big, yet again!