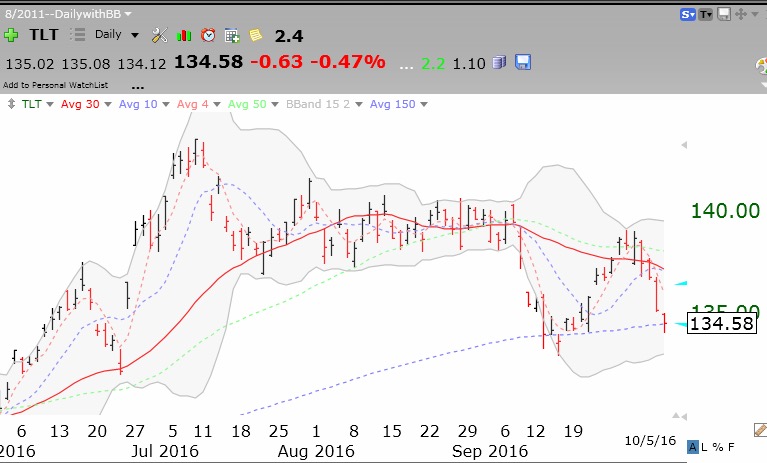
Long term treasury bonds continue to fall, indicating higher interest rates.
Stock Market Technical Indicators & Analysis
Long term treasury bonds continue to fall, indicating higher interest rates.
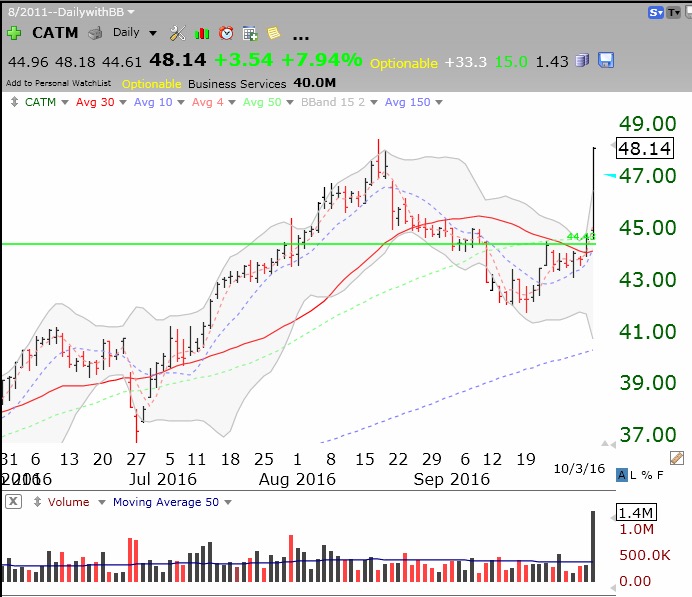
Look at the extraordinary volume of shares (>3x its avg daily vol) traded on CATM with the announcement of an acquisition said to be accretive to earnings. CATM has retaken its green line and is just short of its all-time high of 48.46. Its latest short ratio was around 15.