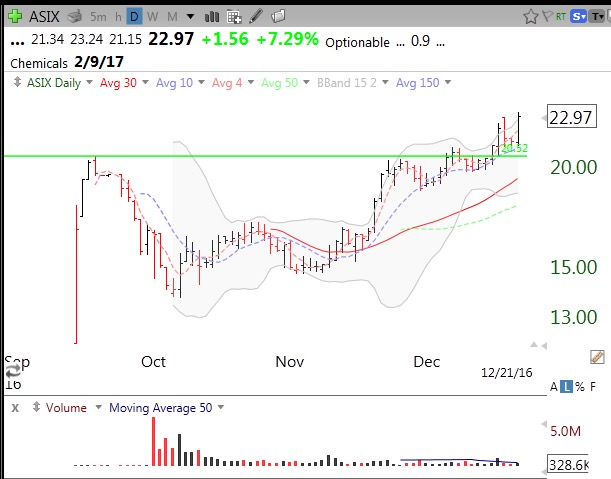
While recent trading volume is unremarkable, spin-off from Honeywell, ASIX, is at an all-time high.
Stock Market Technical Indicators & Analysis
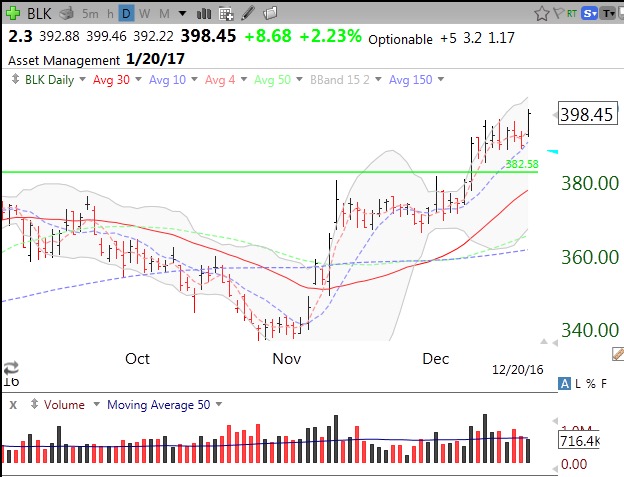
BLK broke out of its green line peak from February, 2015, to an all-time high on December 8 on above average trading volume. It continues to act strong.
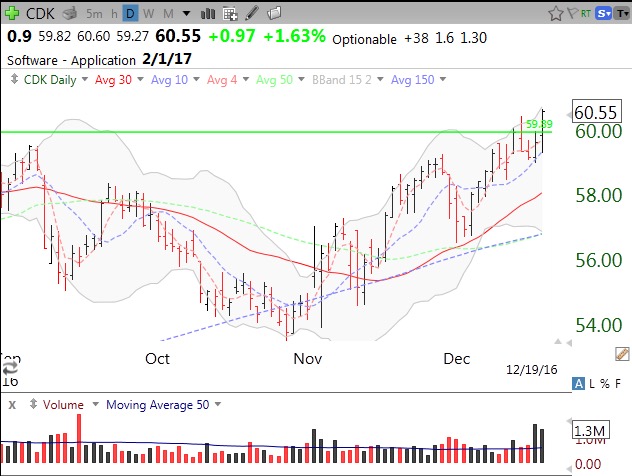
CDK had a GLB to an all-time high on above average volume on Monday. See this IBD review.