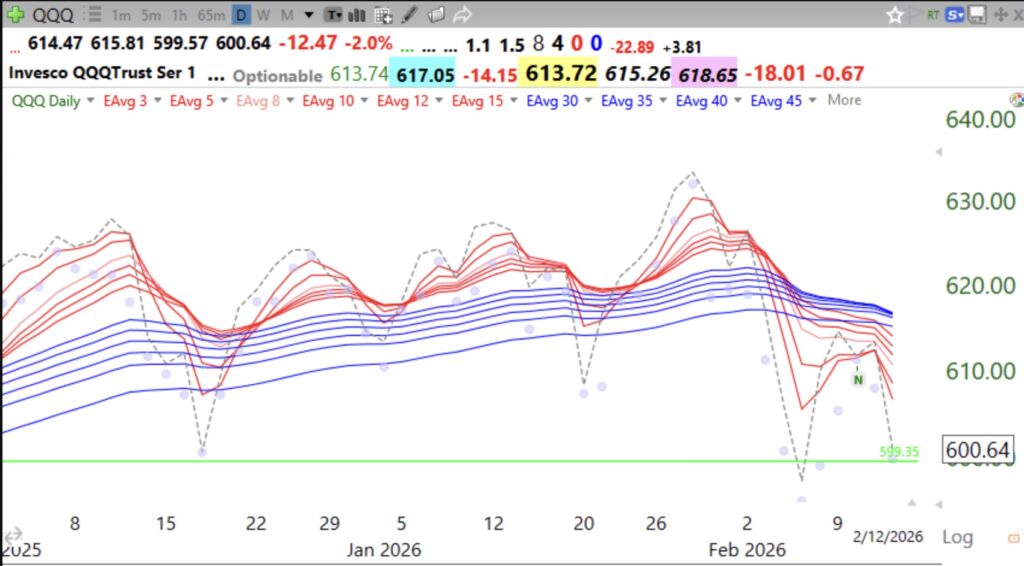
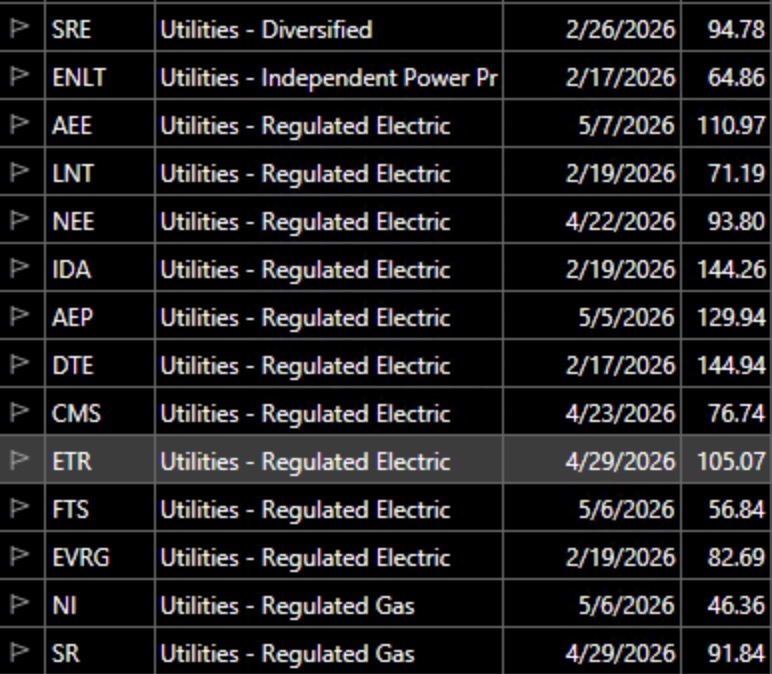
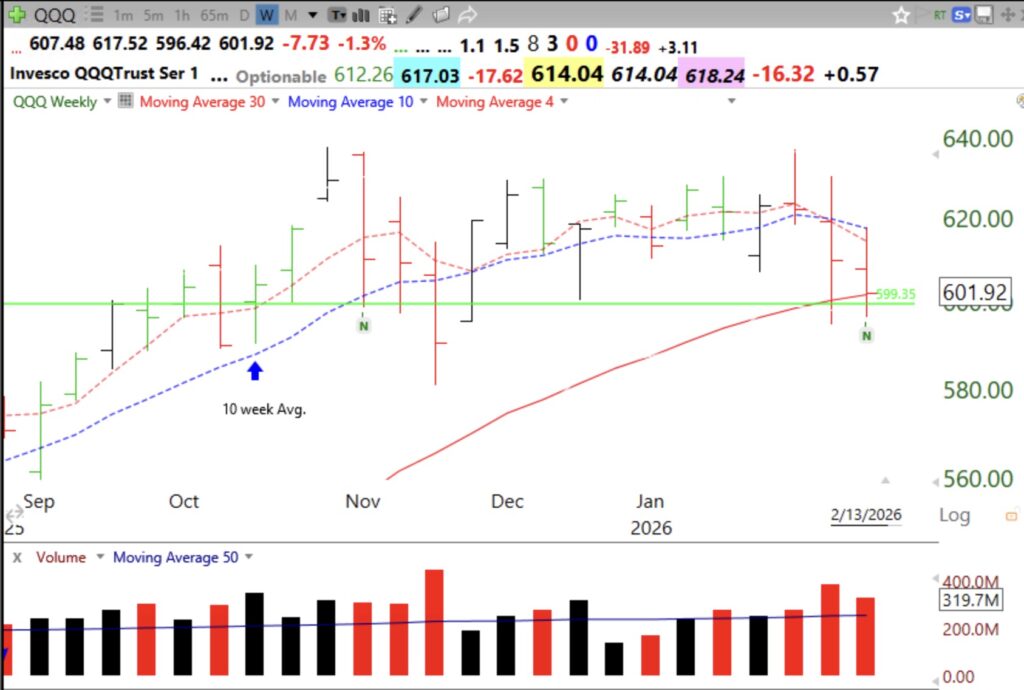
21% of the 61 US stocks reaching an ATH on Friday were utilities! No wonder the GMI and GMI2, heavily focused on QQQ, are so weak. If many traders are suffering losses and margin calls from the former tech and growth leaders, liquidity could dry up in the rest of the market and we could face a significant decline. There are also too many bulls (59.6%) in the recent Investors Intelligence survey. QQQ is now resting just above the last Green Line top (@599.35 see chart). QQQ closed Friday @ 601.92, 2.57 above the Green Line and back to where it was last October. No wonder X is filled with traders complaining about their losses. If the GLB from last October fails, I suspect we will see much more weakness. Date column in the table of utilities below is the expected date of next earnings release.
QQQ is sitting on its last Green Line top from last October and its 30 week average (red line). In other words, QQQ is back to where it was last October! If the 30 week average turns down in a Stage 4 decline, I will exit the markets. That was the signal to help me avoid all prior drops since 2000. Note that the 4 wk average (red dotted) is now below the 10 week average, another sign of weakening. I am largely in cash in my trading accounts with very close stops.
The GMI is still Green but could turn Red this week. The table below shows that the weekly 10.4 Stochastics for QQQ now equals 51. In a strong up-trend it remains above 80 for months!