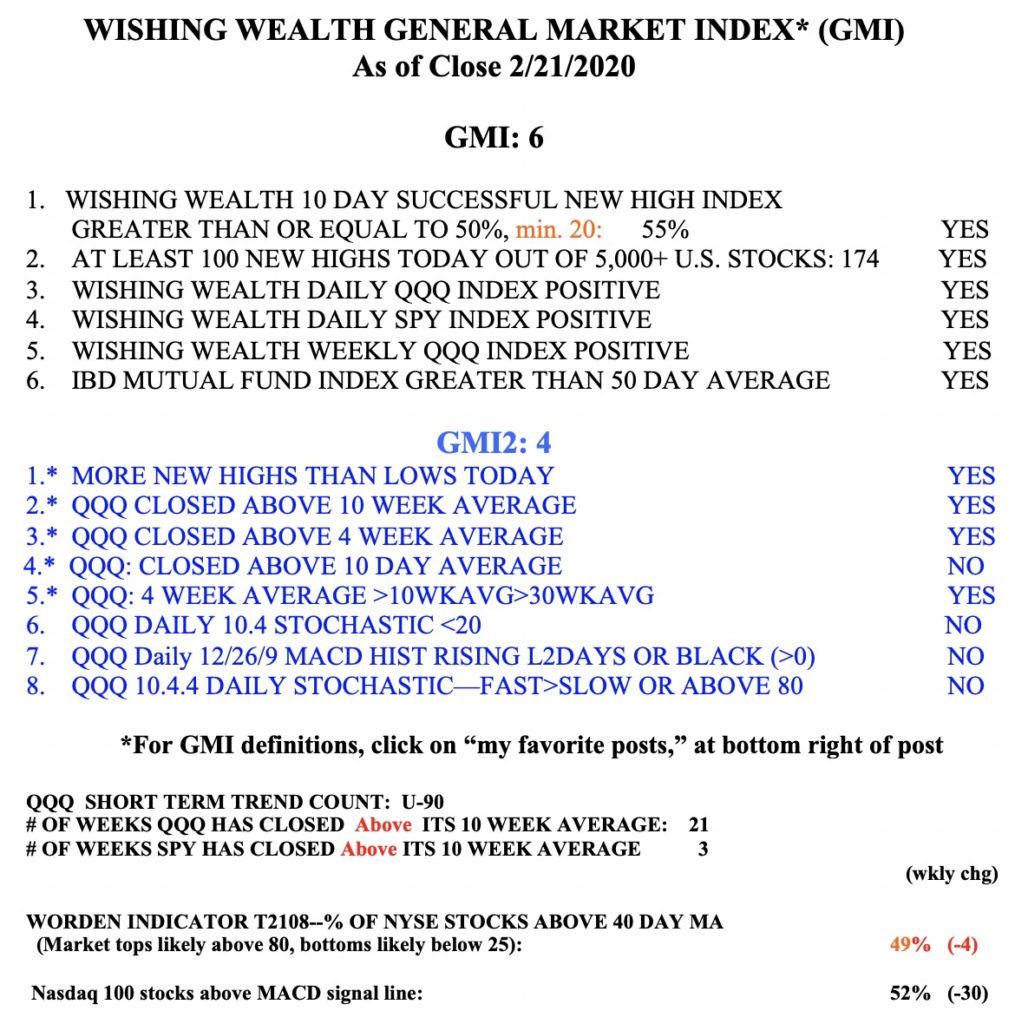
I went to cash in my smaller 457 university pension account on Friday. It had grown so high and I did not want to take a chance of losing much of the gain. I would rather miss out on an advance than suffer a decline. When this virus threat is over I may be brave enough to reinvest. The GMI2 has fallen to 4 (of 8) but the GMI remains at 6 (of 6). If I flew on instrument I would be fully invested. But too much concerns me. I also sold most of my positions in my trading IRA but retained a large position in GLD, which has done well. Next time I want to ride gold, I will instead buy the 3X leveraged bullish gold ETF, UGLD.
A pandemic reminds me that we are all one species inhabiting this planet. A virus does not care what race or nationality we are and what country or state we belong to. Boundaries and countries are artificial concepts that tend to foster differences between people. These manmade differences get in the way of creating a world where everyone is taken care of. I remember that the first astronauts looked down at the earth and marveled that they saw no boundaries, states or countries. Perhaps one day we will create a system for allocating the planet’s resources and the right to survival more humanely and equitably for all human beings….


