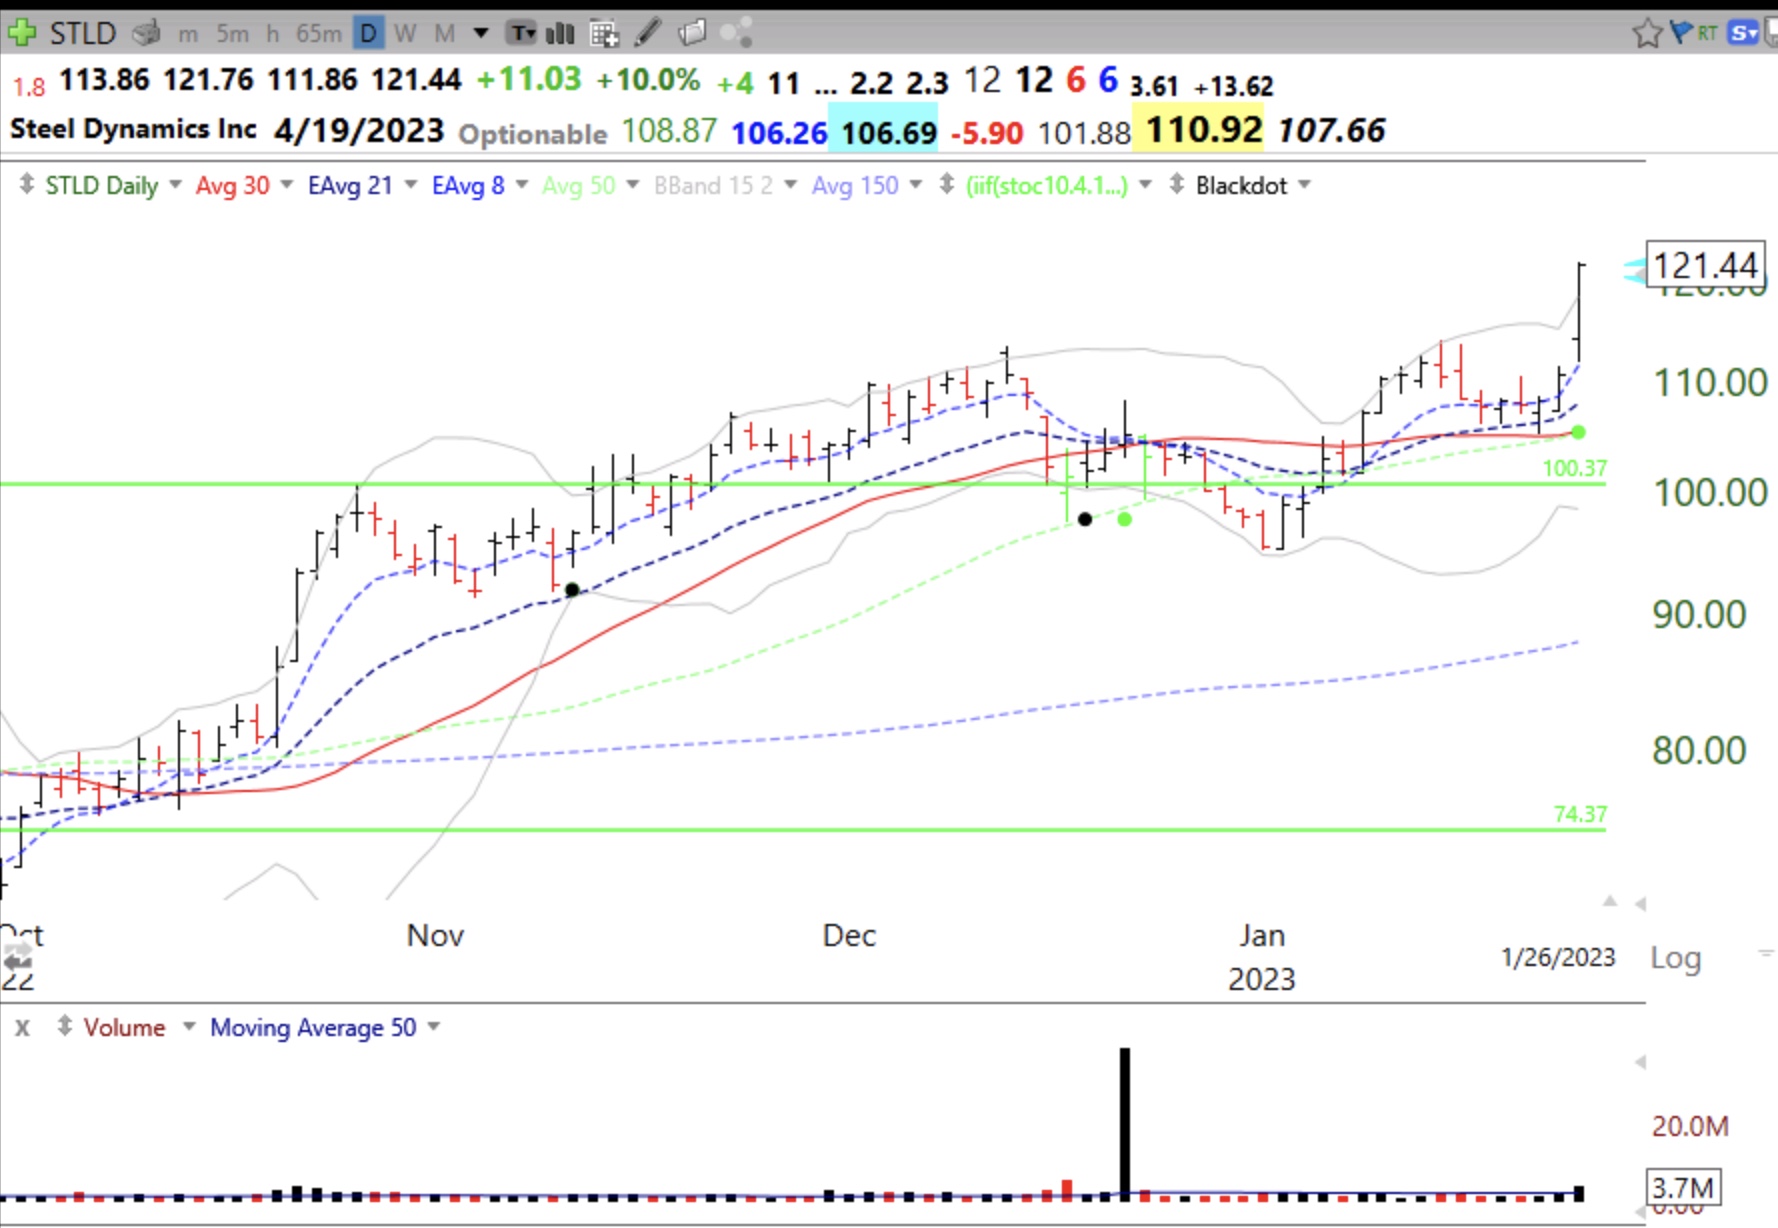
Volume was above the 50 day average on break-out, obscured by one huge volume day in December. Note recent GLB.
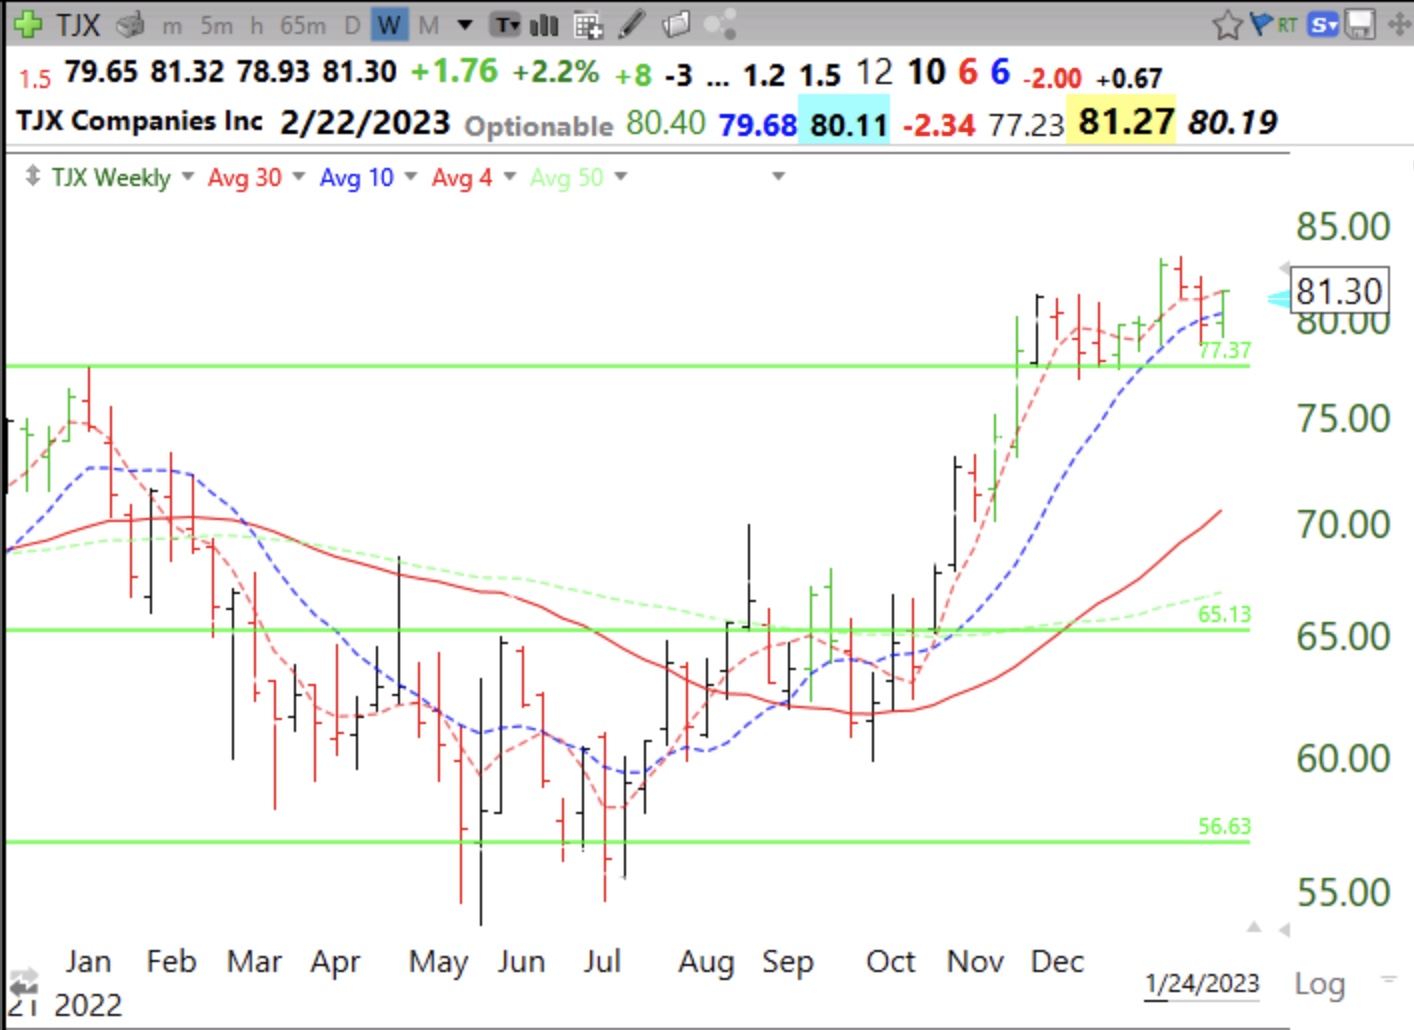
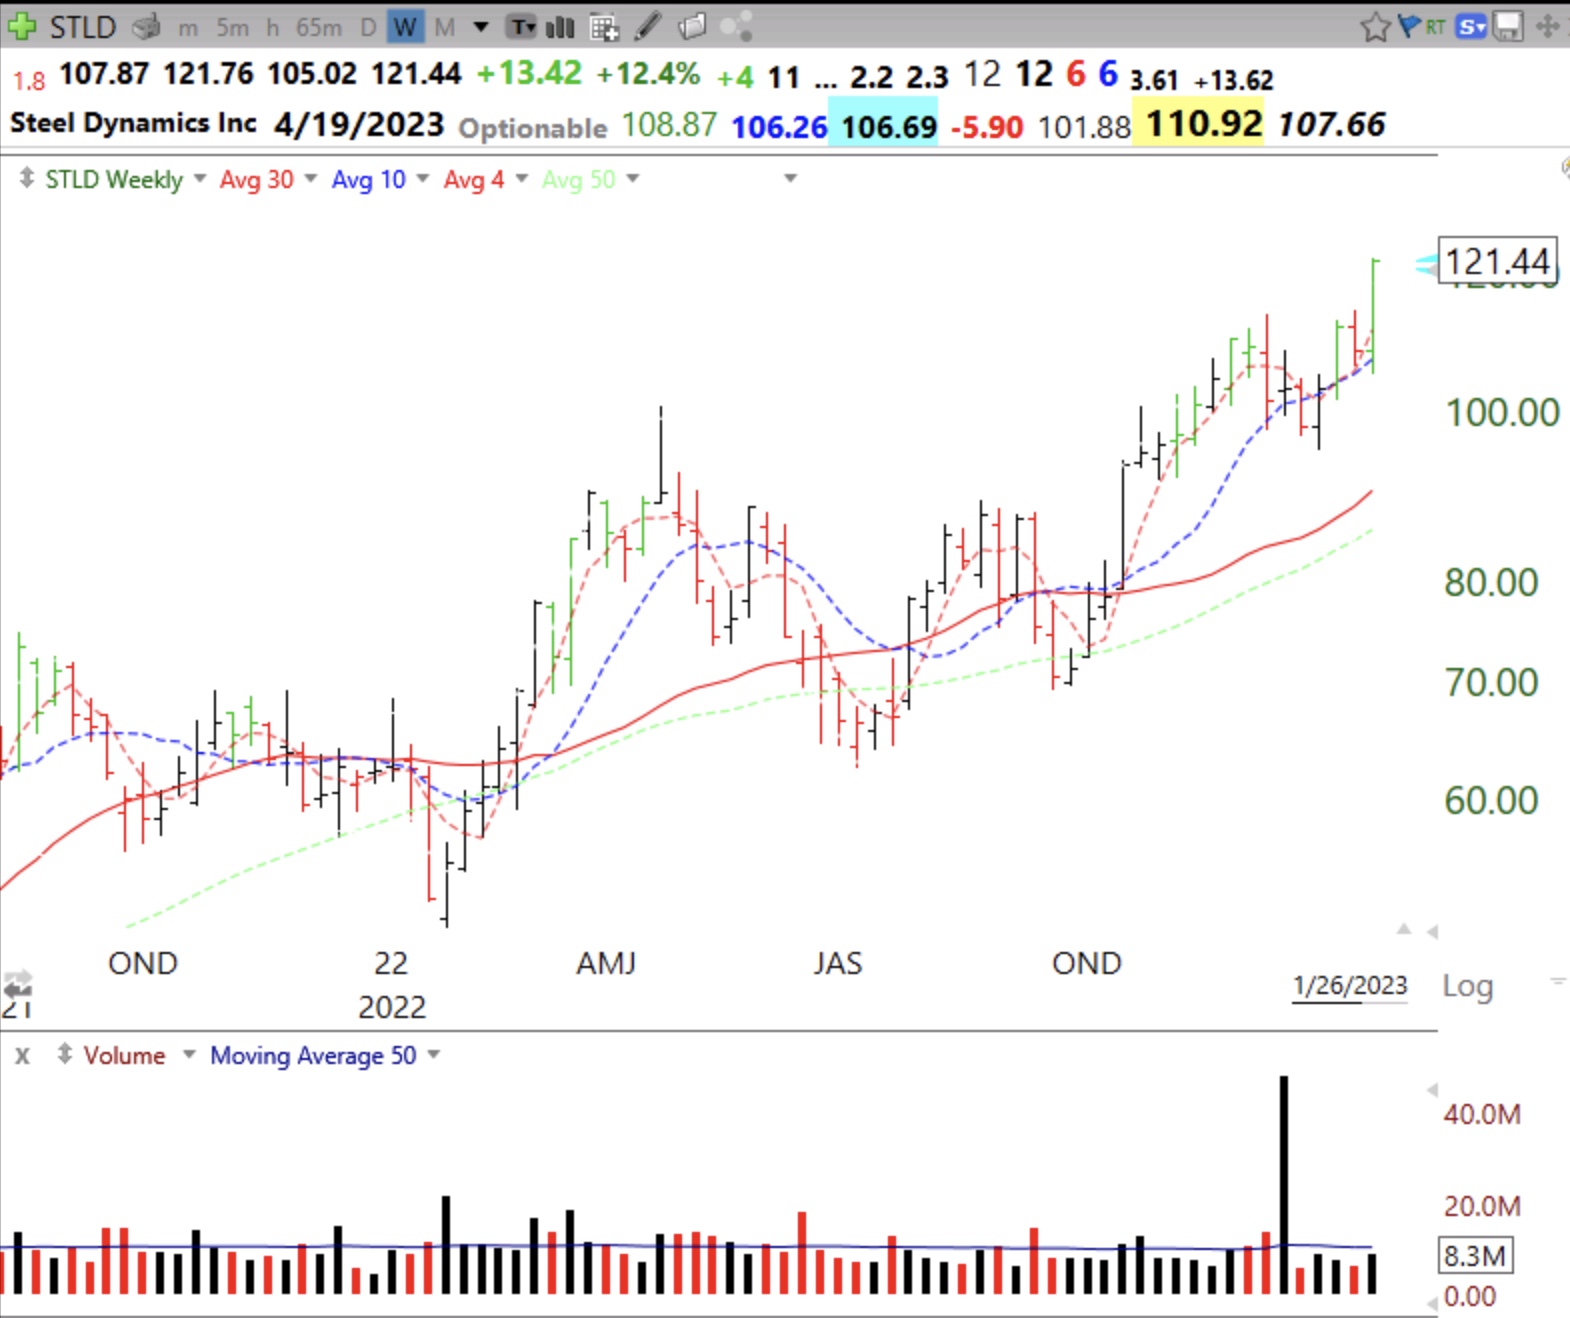
It also has a weekly green bar pattern, which was picked up on my scan. See weekly chart.
Stock Market Technical Indicators & Analysis
Volume was above the 50 day average on break-out, obscured by one huge volume day in December. Note recent GLB.
It also has a weekly green bar pattern, which was picked up on my scan. See weekly chart.
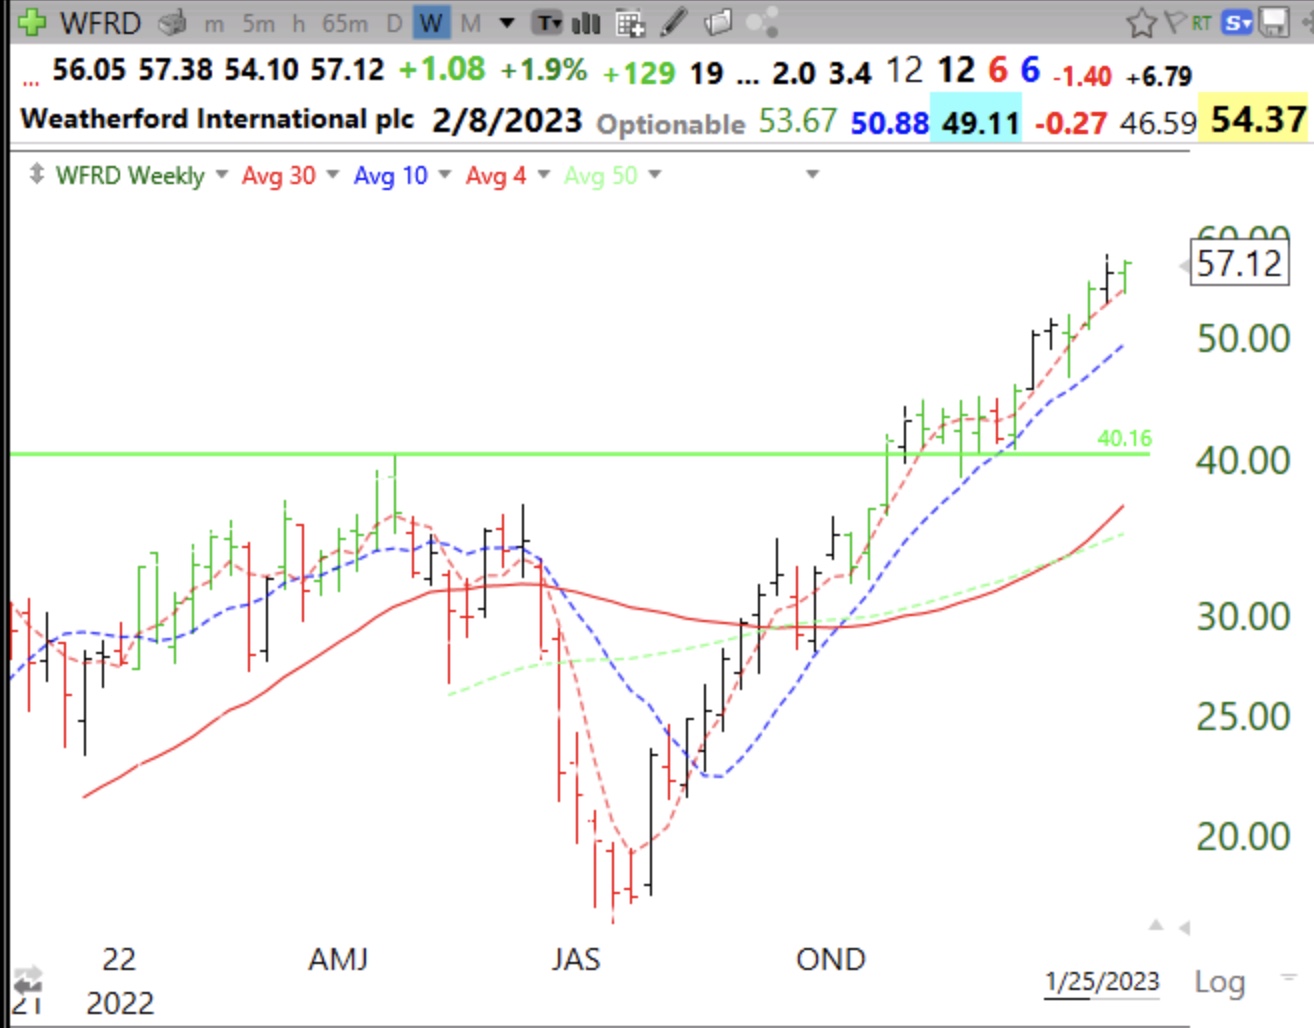
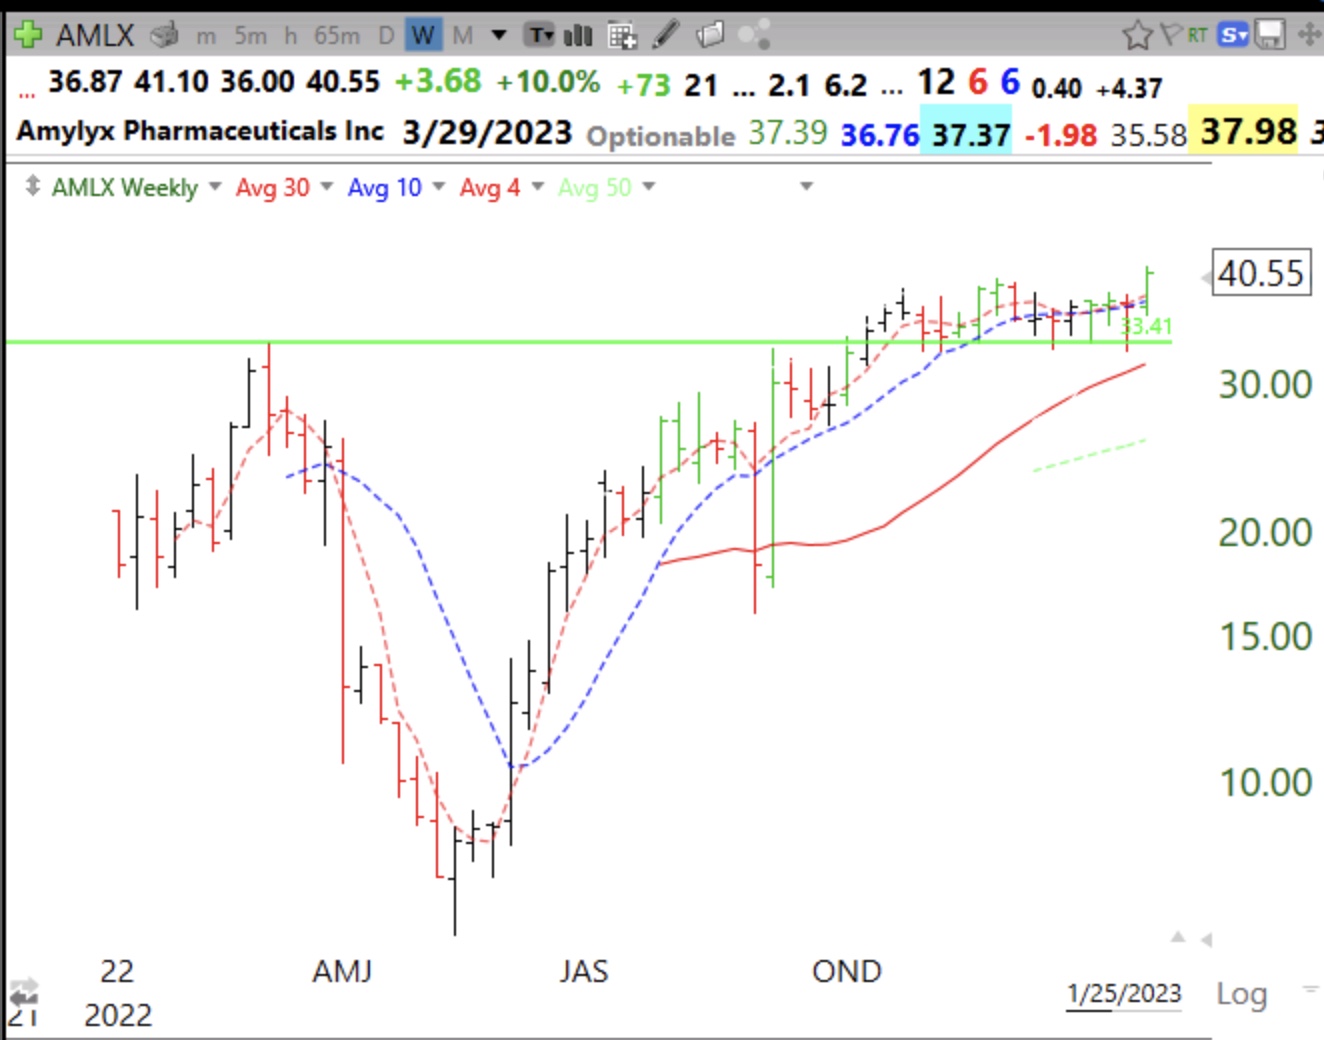
Both had a recent GLB after which they consolidated for several weeks and then broke out again. All had 4wk>10wk>30wk averages, my prime pattern for advancing stocks. They also had a weekly green bar, indicating a bounce up off of the 4 week average. Stocks at new ATHs after a market decline are often the new leaders.
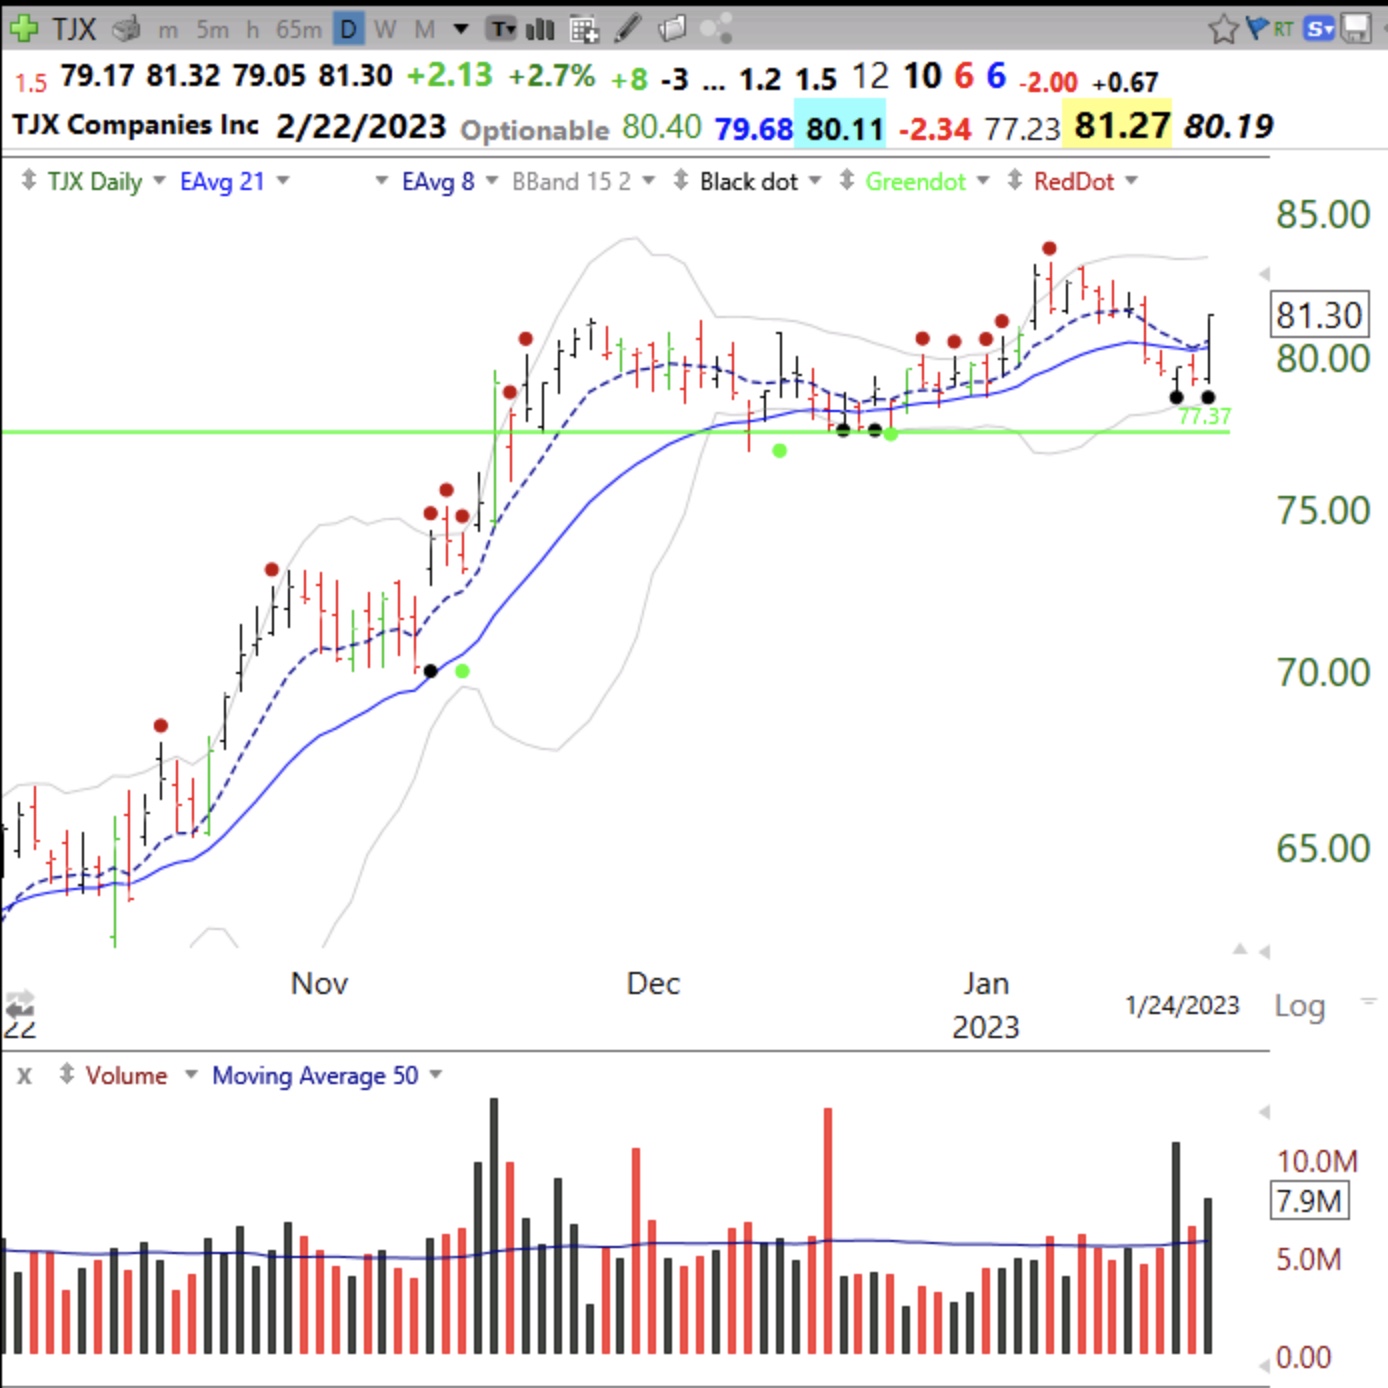
TJX came up on one of my TC2000 scans looking for a stock at a recent ATH that is bouncing off of support or oversold. TJX had a GLB (green line break-out) on November 16 and then went sideways finding support around the green line. It never closed back below the green line. Today TJX closed above its exp21 day average (purple solid line) on higher volume and had recent black dots indicating oversold. If I bought this set-up I would place an immediate sell stop below the recent low. Its composite rating is only 85 but Fidelity Contrafund has a position. It has a nice weekly chart with the avg4>avg10>avg30 and a weekly green bar. While set-ups can give me an edge, I must always have an exit strategy that minimizes potential losses.