I started this blog in April and have been posting every market day. The blog helps me to organize my thoughts and trading, and your many comments empower me. I am taking a vacation for the next week and a half. I will post again between August 12-14. I wish all of you well during this period and hope you will join me when I return. I will be monitoring my email while I am gone. So feel free to send me your thoughts and questions. I will not have my complete charting program with me, however. By the way, anyone who does not want to purchase TC2005 yet can plot the moving averages I have been discussing by going to the free interactive charts at www.bigcharts.com and choosing the 2 moving average chart option.
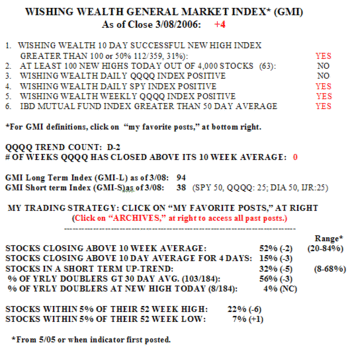
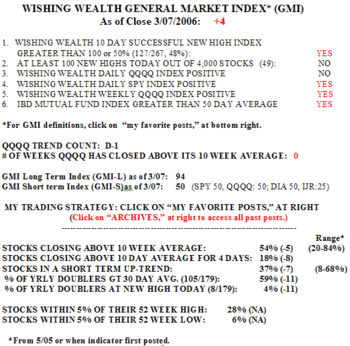
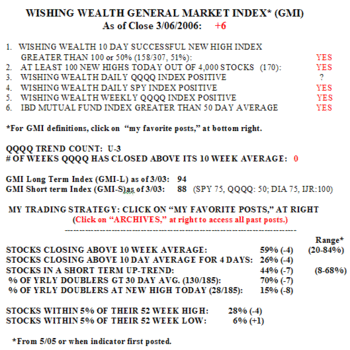
The GMI remains strong, but I sense some cracks in individual stocks. Yes, there were 452 new highs today, but only 74 successful 10 day new highs–60% of the 123 new highs 10 days ago closed higher today than 10 days ago. This is the lowest number of successful 10 day highs since the QQQQ rally began 16 days ago. Only 20%-25% of the stocks in the Nasdaq 100, S&P 500 and Dow 30 advanced today. The QQQQ rally is in day 16 (U-16).
Remember that the GMI will not catch the top. It tells us when we can be fairly certain that the trend of the general market has already turned. So the GMI can be +6 and the market could still be forming a top. So what bothers me? First, stocks are jumping up too quickly. Look at WFMI, ISRG, NDAQ, NTRI. Good news comes out and stocks immediately gap higher. After a significant decline, people are cautious and take profits quickly. Thus few stocks have sustained or large rises. After a period of recovery when the prior decline becomes a distant memory, people take bigger chances. It looks to me like we are in a period when people will make sudden impulsive wagers in order to catch rising stocks. When stocks start to rise that way I become more cautious. (Watch for a close of the QQQQ below its 10 day average, currently around 39.40.)
The other thing that bothers me is the rising interest rates and oil prices. We often have a rally during earnings season in an economic recovery as people try to anticipate good reports or buy after good news. Earnings release time is now almost over and we move into the post-earnings lull when the media and traders will focus on the Fed and the business news. What particularly concerns me is the rise in longer term rates. I have been showing you how the short term interest rate indicator has been hitting new highs almost daily. But now the longer term bonds are beginning to crack. Look at the Naked Chart (see yesterday’s post for an explanation of this type of chart) of TLT, that tracks the 20+ year treasury bonds. The rise in the bonds appears to be over as the dotted line (10 day average) crosses below the red line (30 day average). A falling index means higher interest rates are in store.
Remember I told you a few days ago that I thought FNM and FRE looked sick. Their charts are mirror images of each other. Look at FRE, which I own puts on. The stock is declining and the 10 day average (dotted line) has now crossed below the 30 day average (red line). By the way, check out Jim Cramer’s "Best of Breed" in this sector, NLY. Sure hope you did not follow his recommendation on this mutt! Now, what are these mortgage investment stocks telling us about interest rates and the housing market? I suggest to you that it is not good news…………..
So, while I still am mainly long stocks, I have taken short positions in some stocks (FRE, NKE, PNRA) that look particularly weak to me. While I am away, I will move my sell stops on my longs up just in case we do go into a post earnings release decline. I hope you all prosper during the coming days in our summer of ’05 as we approach that fabulous month for bears–October………………………………
Please send me your feedback at: silentknight@wishingwealthblog.com.