Check out this daily chart of $NVAX:
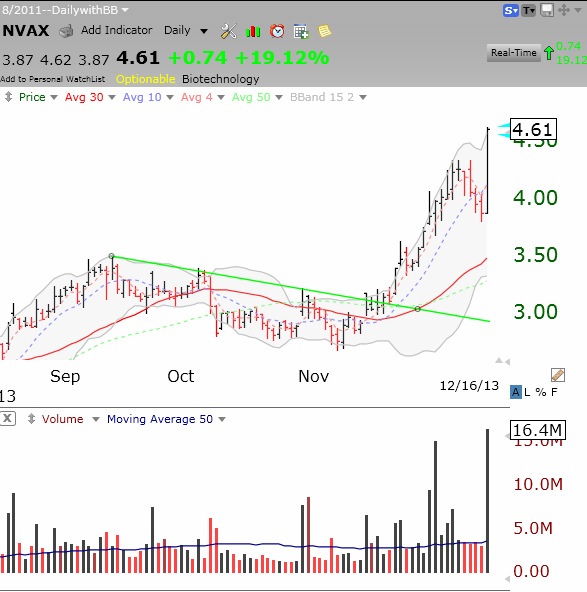 It rose on highest daily volume ever.
Stock Market Technical Indicators & Analysis
Check out this daily chart of $NVAX:
It rose on highest daily volume ever.
The DIA and SPY are weaker than the QQQ. The QQQ remains in a long and short term up-trend. But the GMI-2 is only 3 (of 8) showing that my very sensitive short term indicators have weakened. It remains to be seen whether this will lead to a bigger decline. With end of quarter window dressing not far away, I expect any weakness early in the week to end with a pop higher. I will be looking for formerly strong stocks and indexes in a confirmed up-trend that become oversold and then turn up…
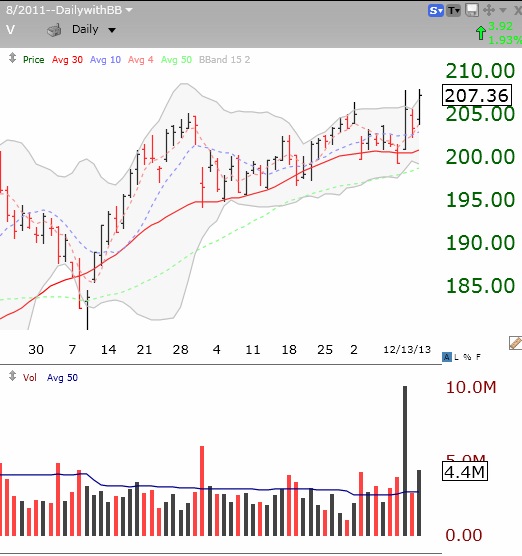
Meanwhile, V, popped to an all-time high last week on huge volume and I took a small position. After a shake-out below its 30 day average (red line), V surged, rested, and then closed Friday above its (15,2) Bollinger Band. We might see a Bollinger Band expansion this week. It also looks like a possible cup and handle break-out.
 Here is the GMI table:
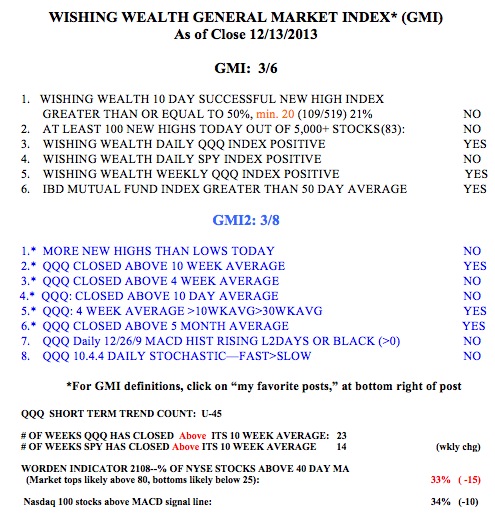
More than 4x more new lows than new highs on Thursday. GMI-2 is down to 3 (of 8).