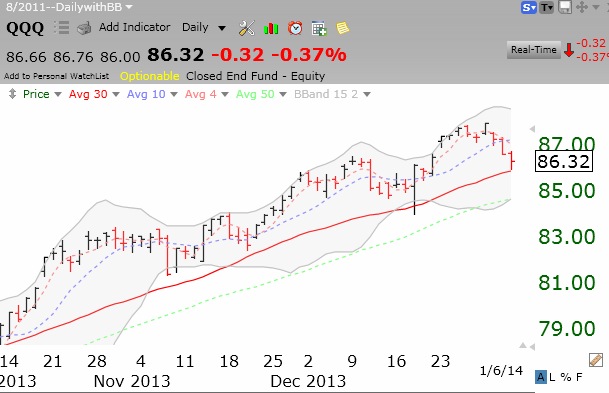
QQQ found support at its 30 day average (solid red line) on Monday. We will learn Tuesday whether it will hold or test the 50 day average (green dotted line) and lower Bollinger Band.
Stock Market Technical Indicators & Analysis
QQQ found support at its 30 day average (solid red line) on Monday. We will learn Tuesday whether it will hold or test the 50 day average (green dotted line) and lower Bollinger Band.
2013 was a strong up year for the market. I though it interesting to make a comparison of how select ETF’s performed if one held them in 2013 and each of the two prior years. The results were illuminating for me. As this table shows, in 2013 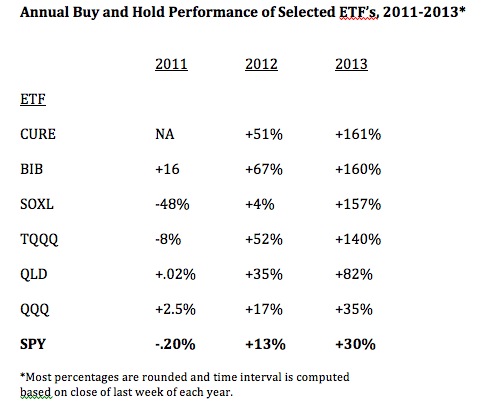 4 leveraged ETF’s far surpassed the performance of the SPY (S&P500 ETF). While SPY rose about +30% and the QQQ (Nasdaq 100 ETF) rose +35%, the other leveraged ETFs in the table rose from +82% (QLD) to +161% (CURE). Are we content to only do better than the SPY or QQQ? Note also that three of the four ETF’s in the table that rose over 100% in 2013 were up 50% or more in 2012. The ETF that is strong in one year may also be strong the following year!
In an up-trending market, the leveraged (bullish) ETF’s are clearly the way to go! Why am I spending all of this time and effort to uncover the rare individual stock that can do better than these leveraged ETFs? Is it the challenge of the game? Is it the hope of appearing smart by finding the few stocks that rocket higher? Is it an addiction to frequent trading? All of the above are terrible reasons to be in the market.
Individual stocks are prone to news and earnings based volatility. In contrast, an ETF provides some protection from event volatility because it represents a basket of stocks. One stock’s sudden decline could be attenuated by the other stocks in that ETF. One might even dispense with attending to the fundamentals for an ETF. All one needs to do is to gradually accumulate a leveraged ETF that is in a confirmed up-trend and to exit gradually as the up-trend ends. (I say gradually, because it takes time for a trend to change and I like to place my bets as the trend develops and I become more confident of the new trend.) My New Year’s Resolution for 2014: to trade mainly the leveraged index ETF’s…….
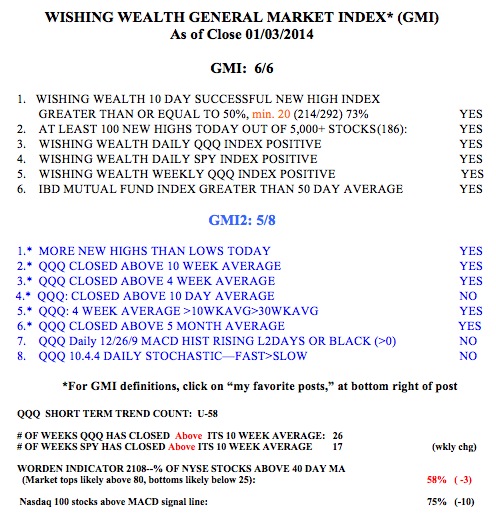
The GMI remains at 6 (of 6). The GMI-2 has weakened a little to 5 (of 8), with its most sensitive short term components turning negative.
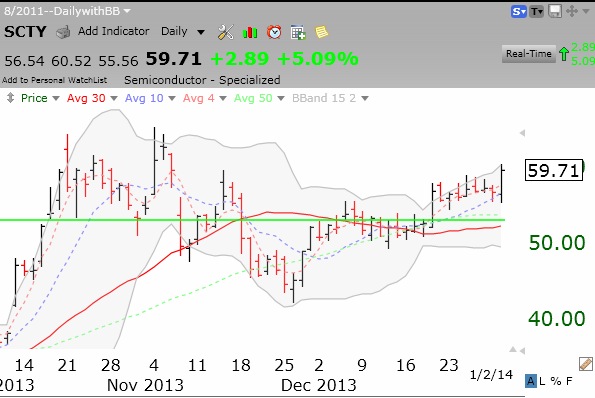
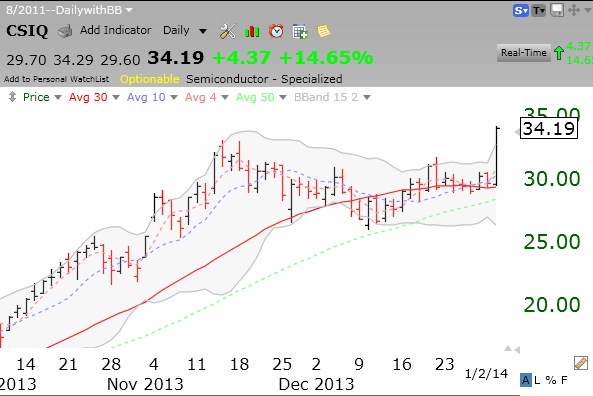
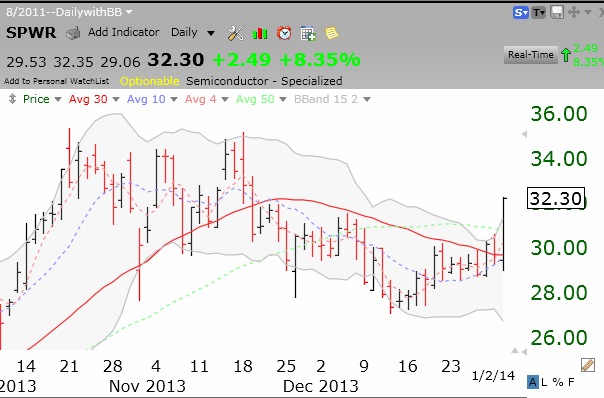
In a down day Thursday, solar stocks shined. Check out these daily charts. Perhaps this market is developing a sunny disposition….