An up day on Monday could trigger a GMI Buy signal. I prefer to wait on the sidelines. Some of my hourly indicators suggest to me that the DIA, QQQ and SPY could retreat Monday from their recent bounce peaks. But if they hold, the market trend will turn up again. I remain very skeptical of a prolonged advance because once earnings release is over, the market might have little to propel it higher. And the Sell in May period is nearly upon us.
Too many of the high flyers have been decimated. Look at what happened to CMG last Thursday when it opened at 582.70 up about $32 on good earnings and closed at 519.61, down 32.79 for the day. Imagine if one had bought it at the open in view of the good earnings announcement. This type of volatility in a market leader suggests to me underlying weakness in the market. AMZN is now down from over $400 to around 325, and TSLA is now at 198, down from a high of around 265. These are just a few of the examples of how the winners have been decimated (see examples below too). It is possible that the bull market for these leaders is over and that people will rotate into other stocks for now. It is also possible and more likely to me, however, that they shoot the leaders first, followed by the rest of the market. With that as a possibility, why would I hold stocks now?
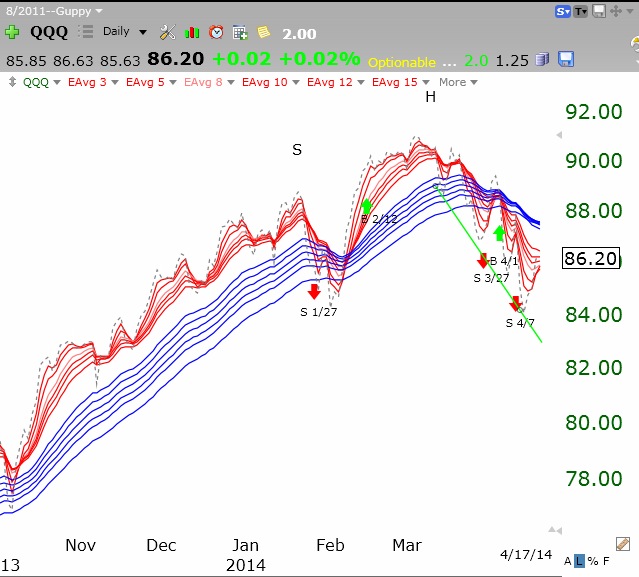
The QQQ stands at 86.20, the same level it was at last December. In other words, this high tech index has not maintained any increase over the last 4 months. The QQQ did advance to around 91, but took a round trip back to 86. I like to use a modified GUPPY GMMA chart to track the major trend of the indexes. It consists of 12 exponential moving averages (3,5,8,10,12,15 = short term averages in red and 30,35,40,45,50,60= longer term averages in blue). I also add a moving average = 1 to show the current close shown as a gray dotted line. I plot the indexes on daily and weekly time frames to show relatively short term and longer term trends. An up market has a red white and blue (RWB) pattern with the red averages rising well above the longer term blue averages. When the white space between the red and blue averages disappears the advance of the index is weakening. A reverse pattern (BWR) demonstrates considerable weakness.
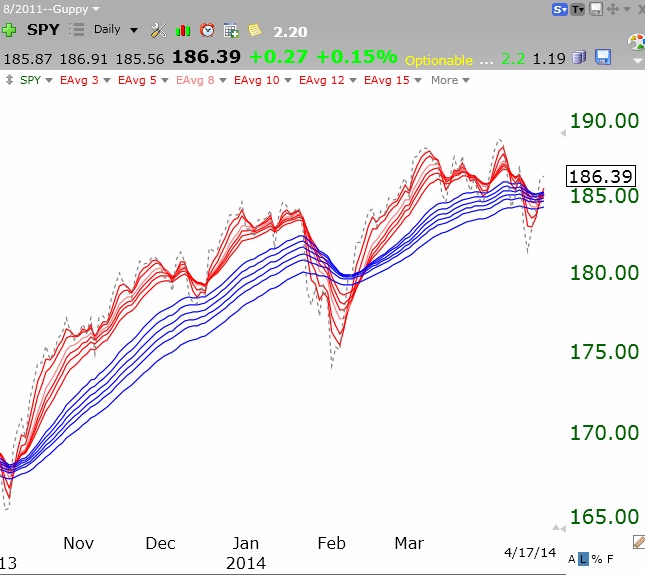
The two daily GUPPY charts of the QQQ and SPY below clearly show the split market we have experienced of late. The QQQ is much weaker than the SPY and is in a BWR pattern. The SPY just has a convergence of the short and longer term averages and no white space separating them. Furthermore, note how long we have had recent RWB advances in both indexes. For me, it pays to be invested long in the market only when an RWB pattern is present.
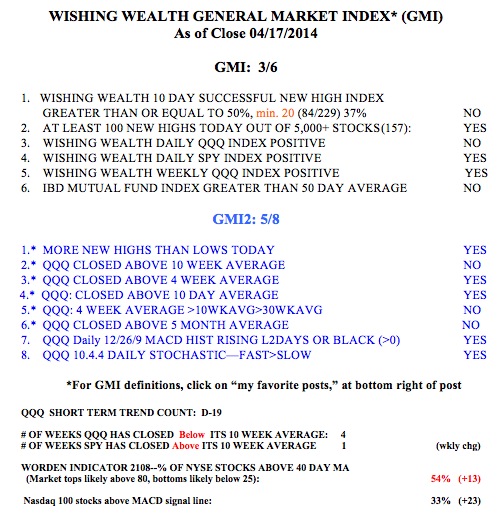
Meanwhile, the GMI is now at 3. Note from the table below that the QQQ has closed below its critical 10 week average for 4 weeks, while the SPY has now closed above its 10 week average. I prefer to remain on the sidelines in my trading accounts until the short term trend of the QQQ turns up. The QQQ has completed the 19th day (D-19) of its short term down-trend that began on March 24 and the QQQ has since declined -2.29%. 69% of the Nasdaq 100 stocks have declined. Eight of the 15 Naadaq 100 stocks that have declined 7% or more during this period are: BIIB, GMCR, GOOG, SBUX, NFLX, AKAM, TSLA, WFM. This is why I do not go long in a short term down-trend–why fight the tide?