QQQ has now bounced above its 30 day average (red line) and its lower Bollinger Band.
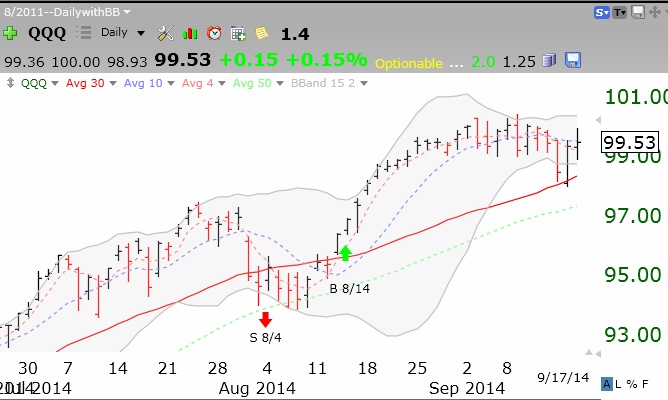
Now on to the Alibaba IPO this Friday.
Stock Market Technical Indicators & Analysis
QQQ has now bounced above its 30 day average (red line) and its lower Bollinger Band.
Now on to the Alibaba IPO this Friday.
Only 47 new 52 week highs in my universe of 6,000 stocks on Monday. Time to be very cautious.