All of my indicators remain positive.
 Dr. Wish
12th day of $QQQ short term up-trend
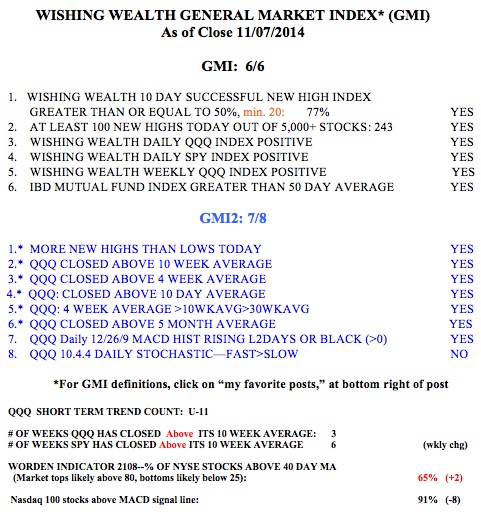
All of my GMI and GMI-2 indicators are positive.
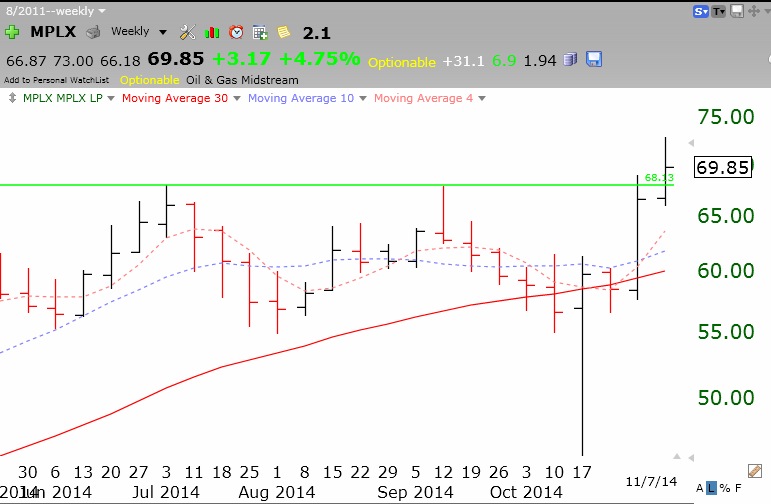
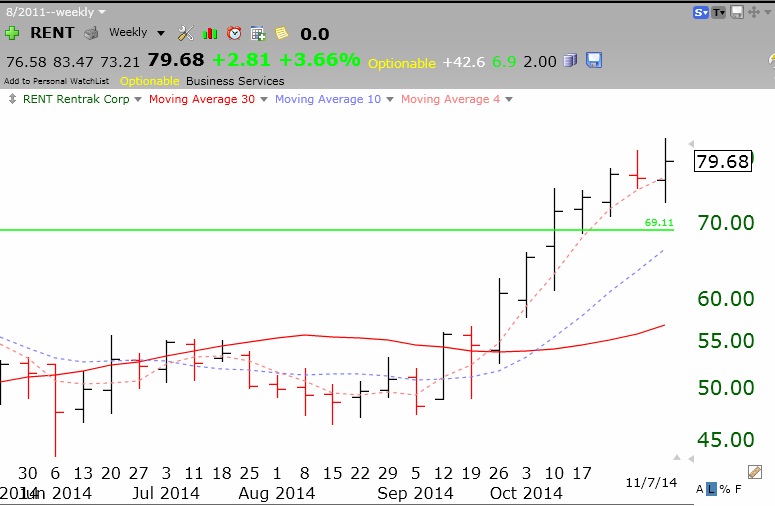
11th day of $QQQ short term up-trend; GLB stocks: $MPLX, $RENT
Here are weekly charts of two stocks that are recent GLB that hit new all-time highs last week.
 Meanwhile, the GMI remains at 6 (of 6).