A lot of stocks bounced from oversold on Wednesday. Another up or flat day will change the QQQ short term trend to an up-trend. The longer term trend remains up. Interest rates continue to rise.
 Dr. Wish
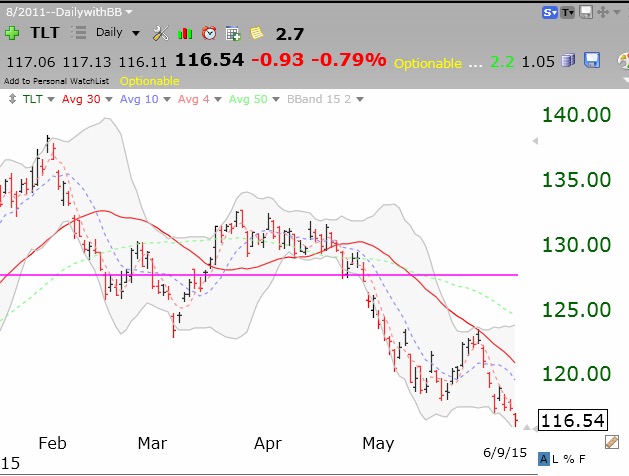
2nd day of $QQQ short term down-trend; $TLT falling as interest rates rise
Indexes are oversold and should bounce. However, P/C ratio is only .89. This market may have to decline further. Bonds are in a free fall as interest rates move higher. Check out the 20 year treasury bond ETF, TLT.
New $QQQ short term down-trend; June swoon?
I noticed that the QQQ short term trend was turning down on Monday and so I sold some positions and hedged others with put options. We are in the period when earnings are mainly out and we often see a decline until 2nd quarter is over and earnings begin to come out in early July. IBD still sees market in confirmed up-trend.