Dr. Wish
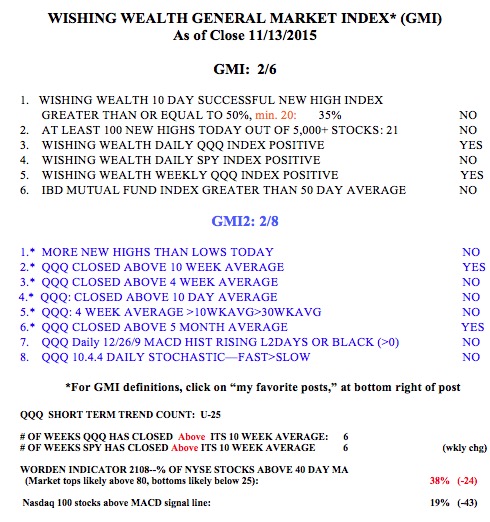
GMI holds as market bounces; $RTN, $TAP and $JBT surge to all-time highs
The scenario I sketched on Sunday night came true with the market bouncing from oversold. Almost one half of the Nasdaq 100 stocks reached extremely oversold levels on Monday. The GMI did not flash a Sell signal. I bought a few positions that bounced up off of support on Monday and will sell if the bounces should fail. I do not know how far this bounce will go. I just place my bets and exit with a small loss if a stock fails. That is the way to prosper in the stock market–small losses and large gains.
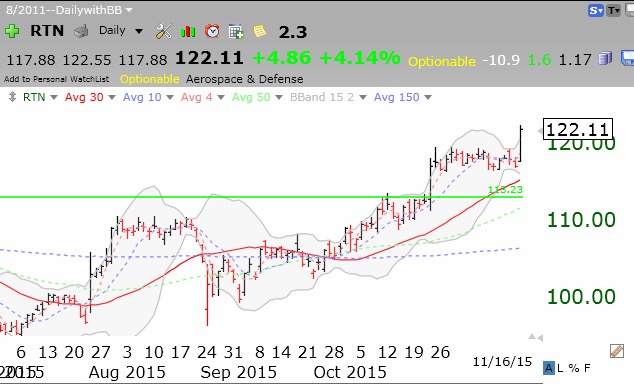
RTN, a recent green line break-out stock, hit an all-time high on Monday.
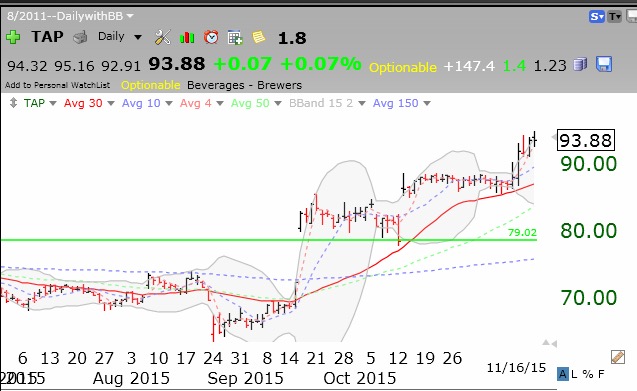
 As did TAP.
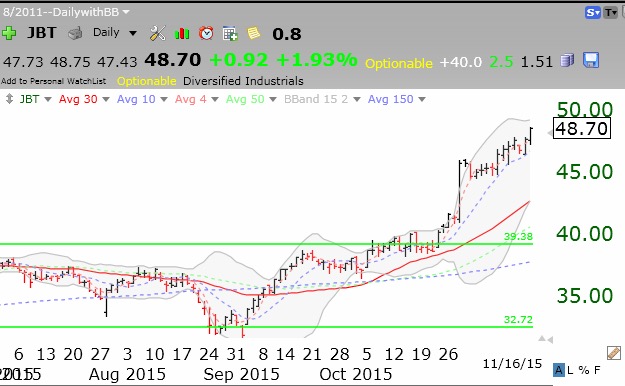
 And JBT.
GMI near a Sell signal, markets at a critical juncture
I wrote weeks ago that I had exited the market in all of my accounts and wanted to see how the rebound from the summer lows proceeded. (I cringed as the market recovered.) The market is now at a very critical point. The indexes could not hold new highs and have turned down. As I posted last week, a major market leader, AAPL, was looking very weak. The biotech leaders have also been slaughtered or wounded. The GMI could flash a Sell signal after Monday’s close. I have reviewed recent GMI Sell signals and found that while such a Sell signal on September 1, 2008, kept me out of the markets during most of the subsequent huge market decline, during the market’s recovery since then, a Sell signal has often come at the bottom of a small decline and the GMI reversed to a Buy shortly afterwards. I do not know which scenario will unfold this week. However, I note that the 10.2 daily stochastics for all of the indexes are approaching very oversold levels and the indexes are below their lower 15.2 daily Bollinger bands. The put/call ratio Friday was also 1.16, suggesting a short term bounce. These market indexes rarely remain so oversold for more than a day or so. I expect a lower opening on Monday because a lot of people typically panic and decide to sell after a major Friday decline. However, now we must add to that the horrible news from Paris for investors and traders to ponder over the weekend.
If the indexes have an early day sell off on Monday and can maintain a recovery through just before the close, around 3:45 PM, I will hold my breath and consider buying an index ETF (SPY or QQQ). If the indexes then continue to hold over the next few days I will increase my position. Because I am out of the market and not suffering losses during this market weakness it is much easier for me psychologically to consider wading back into the market in my trading accounts. I also suspect we will still get some strength in the markets during the last few weeks of the year as the institutions adjust their holdings to look good (window dressing) for their year end portfolio reports to their investors. Remember, major advances are typically preceded by a market decline. (During the decline the smart money buys the stocks we are selling and holds them through the subsequent rise–as the saying goes, stocks go from weak hands into strong hands.) However, if the market indexes do not hold next week, I will remain on the sidelines, safely observing the carnage from a distance.
My current and former university students should easily understand the above. Others who want to understand my trading strategy better might view my free December 2012 TC2000 webinar, which is posted to the right of this page, or click here.