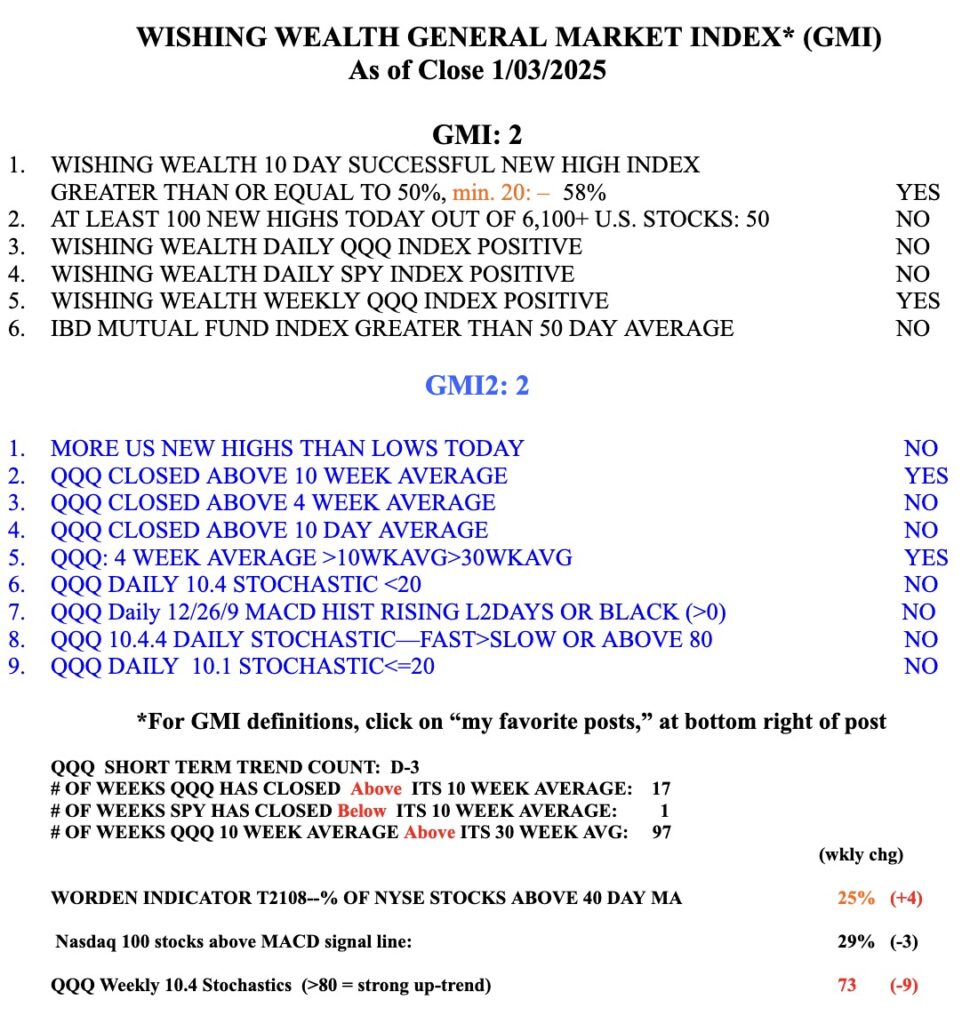
I will not post again until next Tuesday. I sold my SQQQ today after the strong showing of QQQ. I have noted that about 40% of the new QQQ short term down-trends end within 5 days. Let’s see what happens early next week. 
Screenshot
Stock Market Technical Indicators & Analysis
Thursday should be an interesting day. QQQ has now closed below its 10 week average and my QQQ short term trend indicator has turned down. However, about 40% of new QQQ short term down-trends have ended before 5 days. I own a little SQQQ, which rises when QQQ declines, and will add more only if the down-trend continues. I have exited almost all long positions but have kept a few small positions as “bookmarks” on stocks in case they should strengthen. I could easily be wrong about the market but things do not add up. There are more new lows than highs and few stocks are rising. The past 3 days there have been only 5-6 stocks trading at ATHS. I cannot profit by buying stocks at highs when the odds are so slim. I am a chicken and don’t mind waiting on the sidelines for now. Too may people are holding gains and expecting a third good year for the market. The recent Investors Intelligence poll of investment newsletters shows only 16% bearish and it recently registered 60% + bullish, a very dangerous amount of positive expectations. Sentiment polls are contrarian indicators with the market usually going against the majority. The market is designed to make fools of the majority. Too many events are to happen in January, which could lead to extreme volatility. I do much better when the GMI is Green and 5 or 6. If it should turn to 0, I will begin to sell mutual funds in my university retirement accounts. I am too near retirement to gamble with my life savings.
Unlike DIA, QQQ and SPY are capitalization weighted indexes, which means that the capitalization rather than each stock price is averaged. Therefore huge cap stocks drive the index. Everyone knows that a small number of large cap stocks have accounted for most of the rise in SPY, and QQQ. The equal weight ETF for QQQ, RSP, is not cap weighted so that the huge cap stocks do not over weight the index. This adapted daily Guppy chart shows that RSP is now in a BWR down-trend. This is not good for the bullish case. Most stocks are not rising. The key to surviving in investing in stocks is to lose little. Be Careful!!!!! Happy New Year…..

.
Many persons holding large gains may be waiting to sell in the new tax year. The market internals are terrible, with most stocks declining. I am mainly in cash or TBIL in my trading accounts and prefer to watch from the sidelines. If Tuesday leads to a new QQQ short term down-trend I will slowly accumulate SQQQ. The recent rebound in QQQ after the decline in mid-December has failed to retake the prior highs. Lower highs are not bullish. I am a chicken and prefer to buy when the GMI is 5 or 6. The GMI currently =2.
