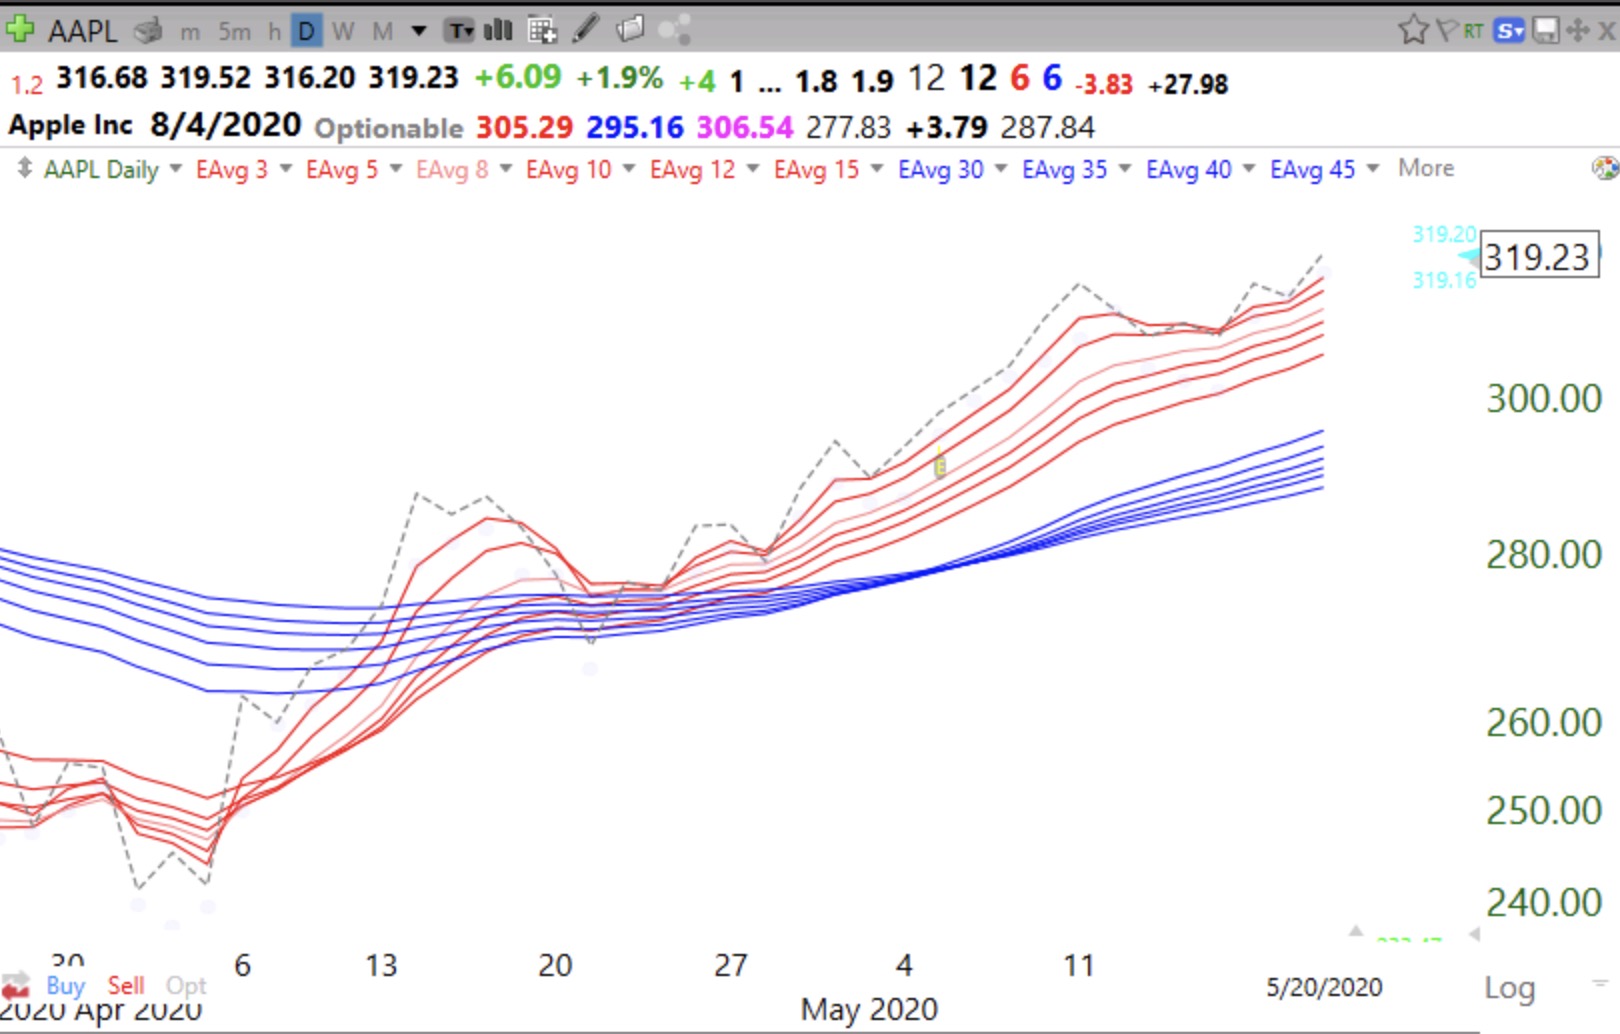
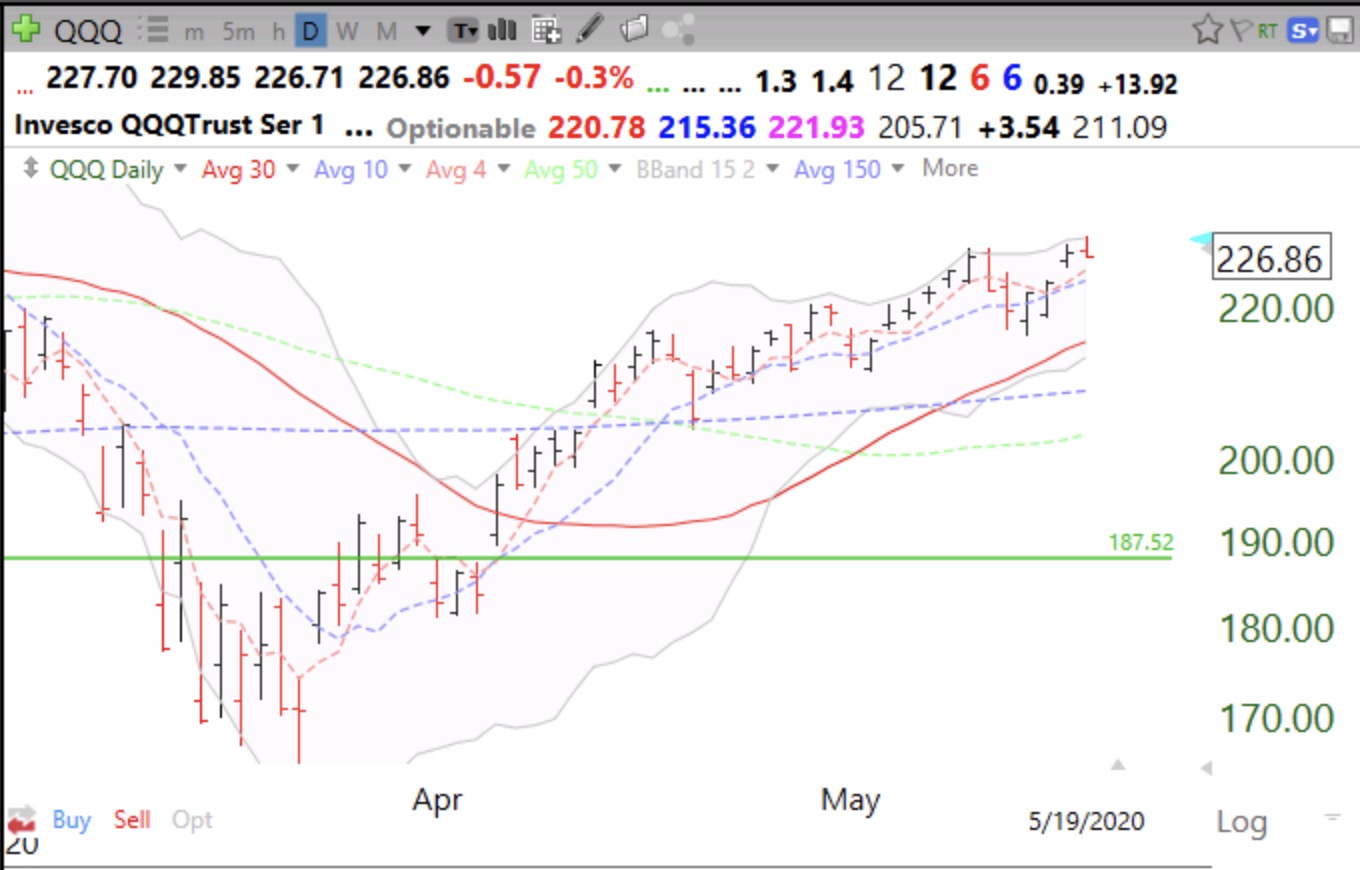
$AAPL in daily RWB up-trend; 31st day of $QQQ short term up-trend Wednesday, May 20, 2020 @ 9:41 pm by Dr. Wish GMI5/6 GMI-26/9 T210873%
30th day of $QQQ short term up-trend Wednesday, May 20, 2020 @ 6:54 am by Dr. Wish GMI5/6 GMI-26/9 T210869%
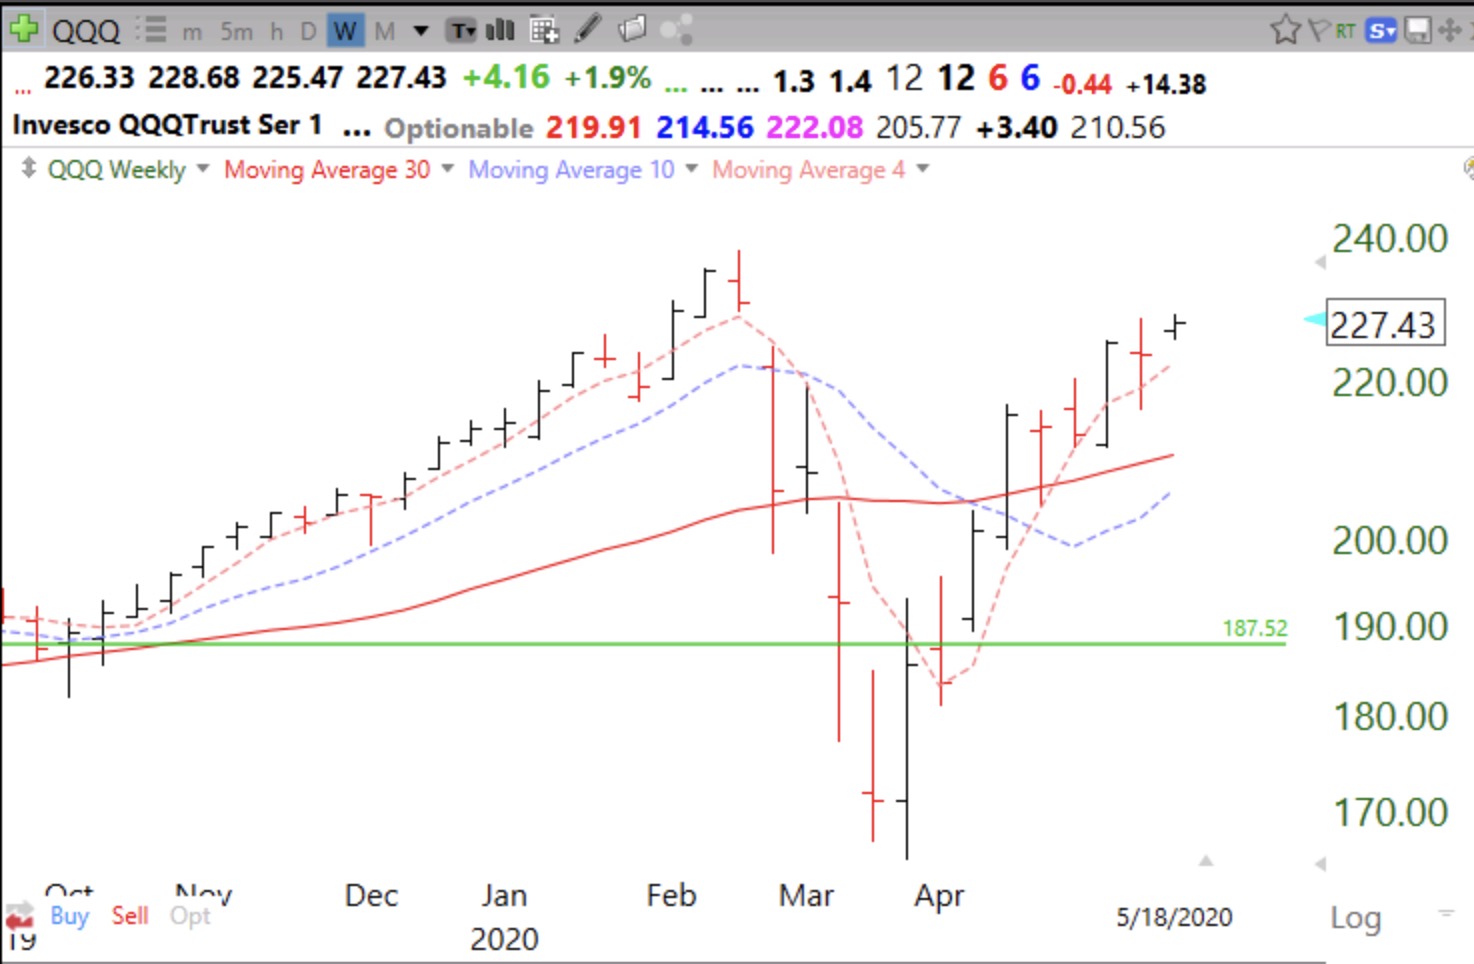
Weekly chart shows $QQQ approaching last ATH; 29th day of $QQQ short term up-trend, GMI back to 6 (of 6). Monday, May 18, 2020 @ 8:30 pm by Dr. Wish GMI6/6 GMI-25/9 T210875%