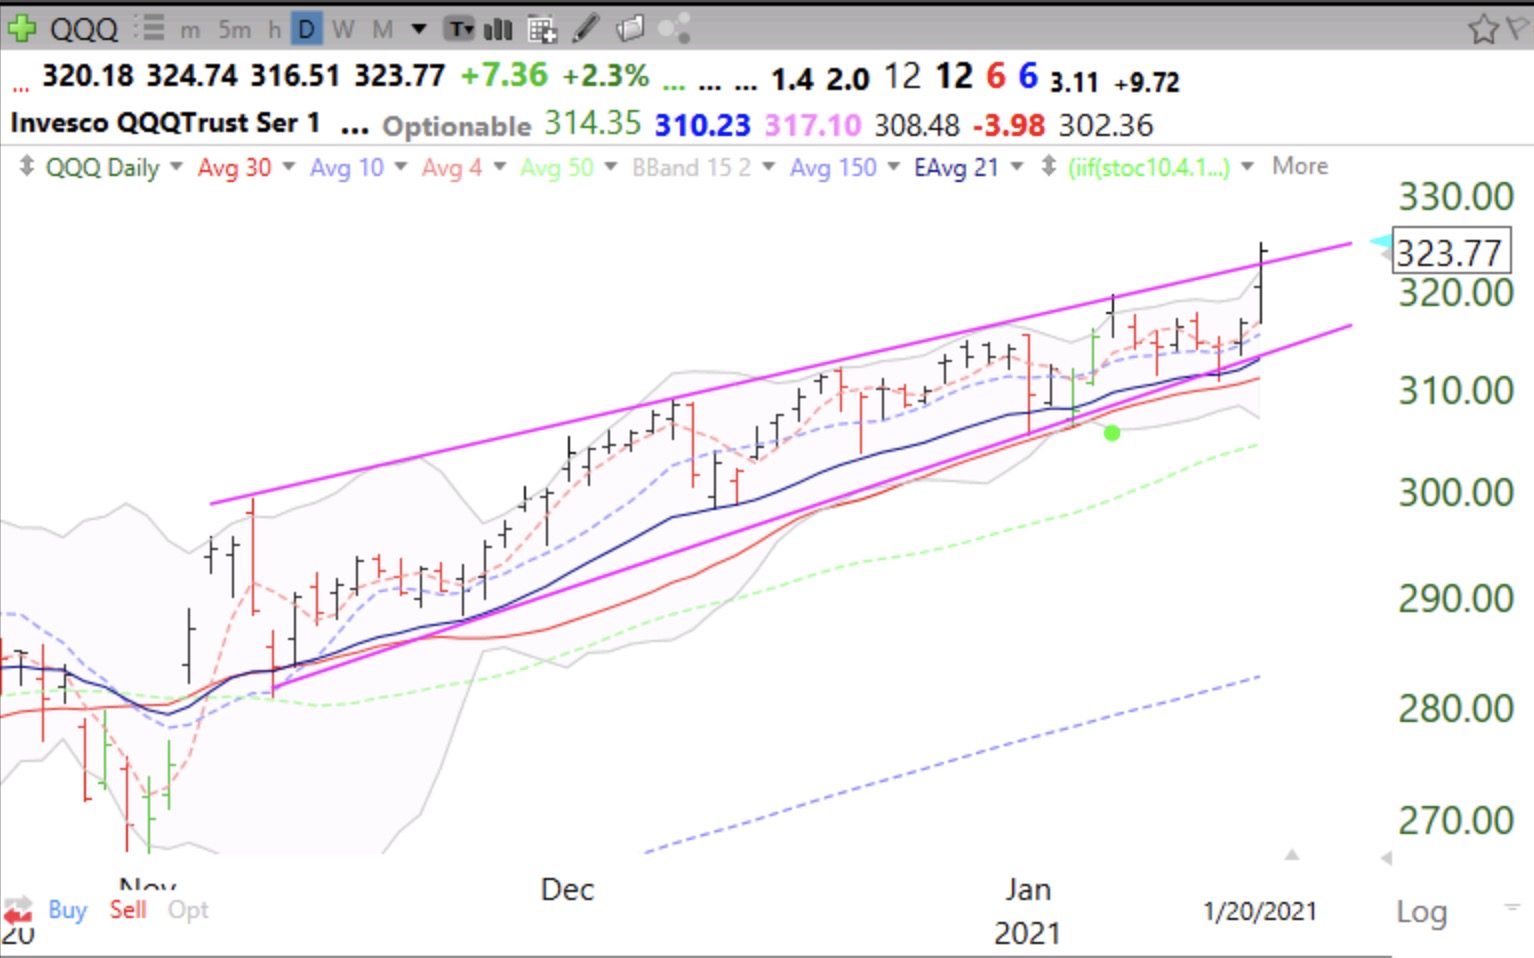
An overshoot of a channel can be a sign of impending weakness if it fails. We shall see.
Stock Market Technical Indicators & Analysis
 Dr. Wish
 An overshoot of a channel can be a sign of impending weakness if it fails. We shall see.
For many years I have shown that holding the triple leveraged Nasdaq100 ETF, TQQQ, in an up-trend would have outperformed 90% or more of the individual stocks in the major indexes. This weekend I found unexpected results, presented in the table below. As expected, during the time since I identified the beginning of the current QQQ short term up-trend on 11/5/20, QQQ has gained +5.95% while its 3x leveraged ETF gained an expected +17.6%. (TQQQ is designed to move 3x QQQ but this goal is not always exactly achieved.) This table shows the top 10 performers in 4 groups of individual stocks, Dow30, S&P500, Nasdaq100 and a Growth Stock watchlist I created based on stocks primarily cited in IBD50 and MarketSmith250 growth lists over a number of months.
I began to trade profitably after I started receiving the IBD newspaper in the mid 1980s. IBD specializes in market timing and identifying the greatest growth stocks. IBD initially published an IBD100 list of promising growth stocks, which has now become the smaller IBD50 list. Their site, investors.com, also posts lists for IPO Leaders and other groups of stocks. MarketSmith, the modern growth stock platform also run by IBD, publishes the Growth250 list which contains the results of various scans they run to identify promising stocks. Periodically, I import stocks on these lists to a watchlist in TC2000 so I can analyze them using the many technical indicators and scans I have created over the past 30+ years.
What amazed me today was that I found that about 25% of the Nasdaq100 stocks, 38% of the S&P500 stocks and 60% of the IBD/MarketSmith Growth Stocks beat just holding TQQQ! In the past, only about 10% or less of the individual stocks in the major indexes beat TQQQ. I never compared TQQQ to the growth stocks before but I assume they would have outperformed them too. Note also the relatively small gains in the top 10 Dow 30 stocks (+25% to+48%) compared with the top 10 gains in the other indexes. I was surprised to find that the top 10 stocks in the S&P500 (+71% to +126%) outperformed the top stocks in the Nasdaq100 (+33% to +89%) even though this was a period defined by the QQQ being in a short term up-trend. However, note that SPY (+7.3%) did beat QQQ (+5.9%). The top 10 stocks in my Growth Stock list put the other lists to shame (+125% to +386%). Now I know many readers will say that the larger the list the more chance that one can find 10 outstanding stocks. But note that the median gain in the Growth Stocks was +24%. This means that one half of the stocks in this list advanced more than 24%, far better than the 17.6% one would get by holding TQQQ. Also, most of the Growth Stocks were taken from lists accessed before December.
So maybe picking individual stocks now has a much higher probability as a strategy than formerly when TQQQ would beat 90%+ of individual stocks. Perhaps one can identify the 50% of stocks on the Growth Stock list that will greatly outperform TQQQ. My conclusion is to focus my attention on promising growth stocks as long as I manage the risk with stops and position size. Thanks to the efforts of Mark Minervini, @markinervini, and Irusha Peiris, @IBD_Irusha, my undergraduate students have the opportunity to learn how to use the IBD and MarketSmith platforms to find growth stocks. These experienced traders have even lectured to my students…….
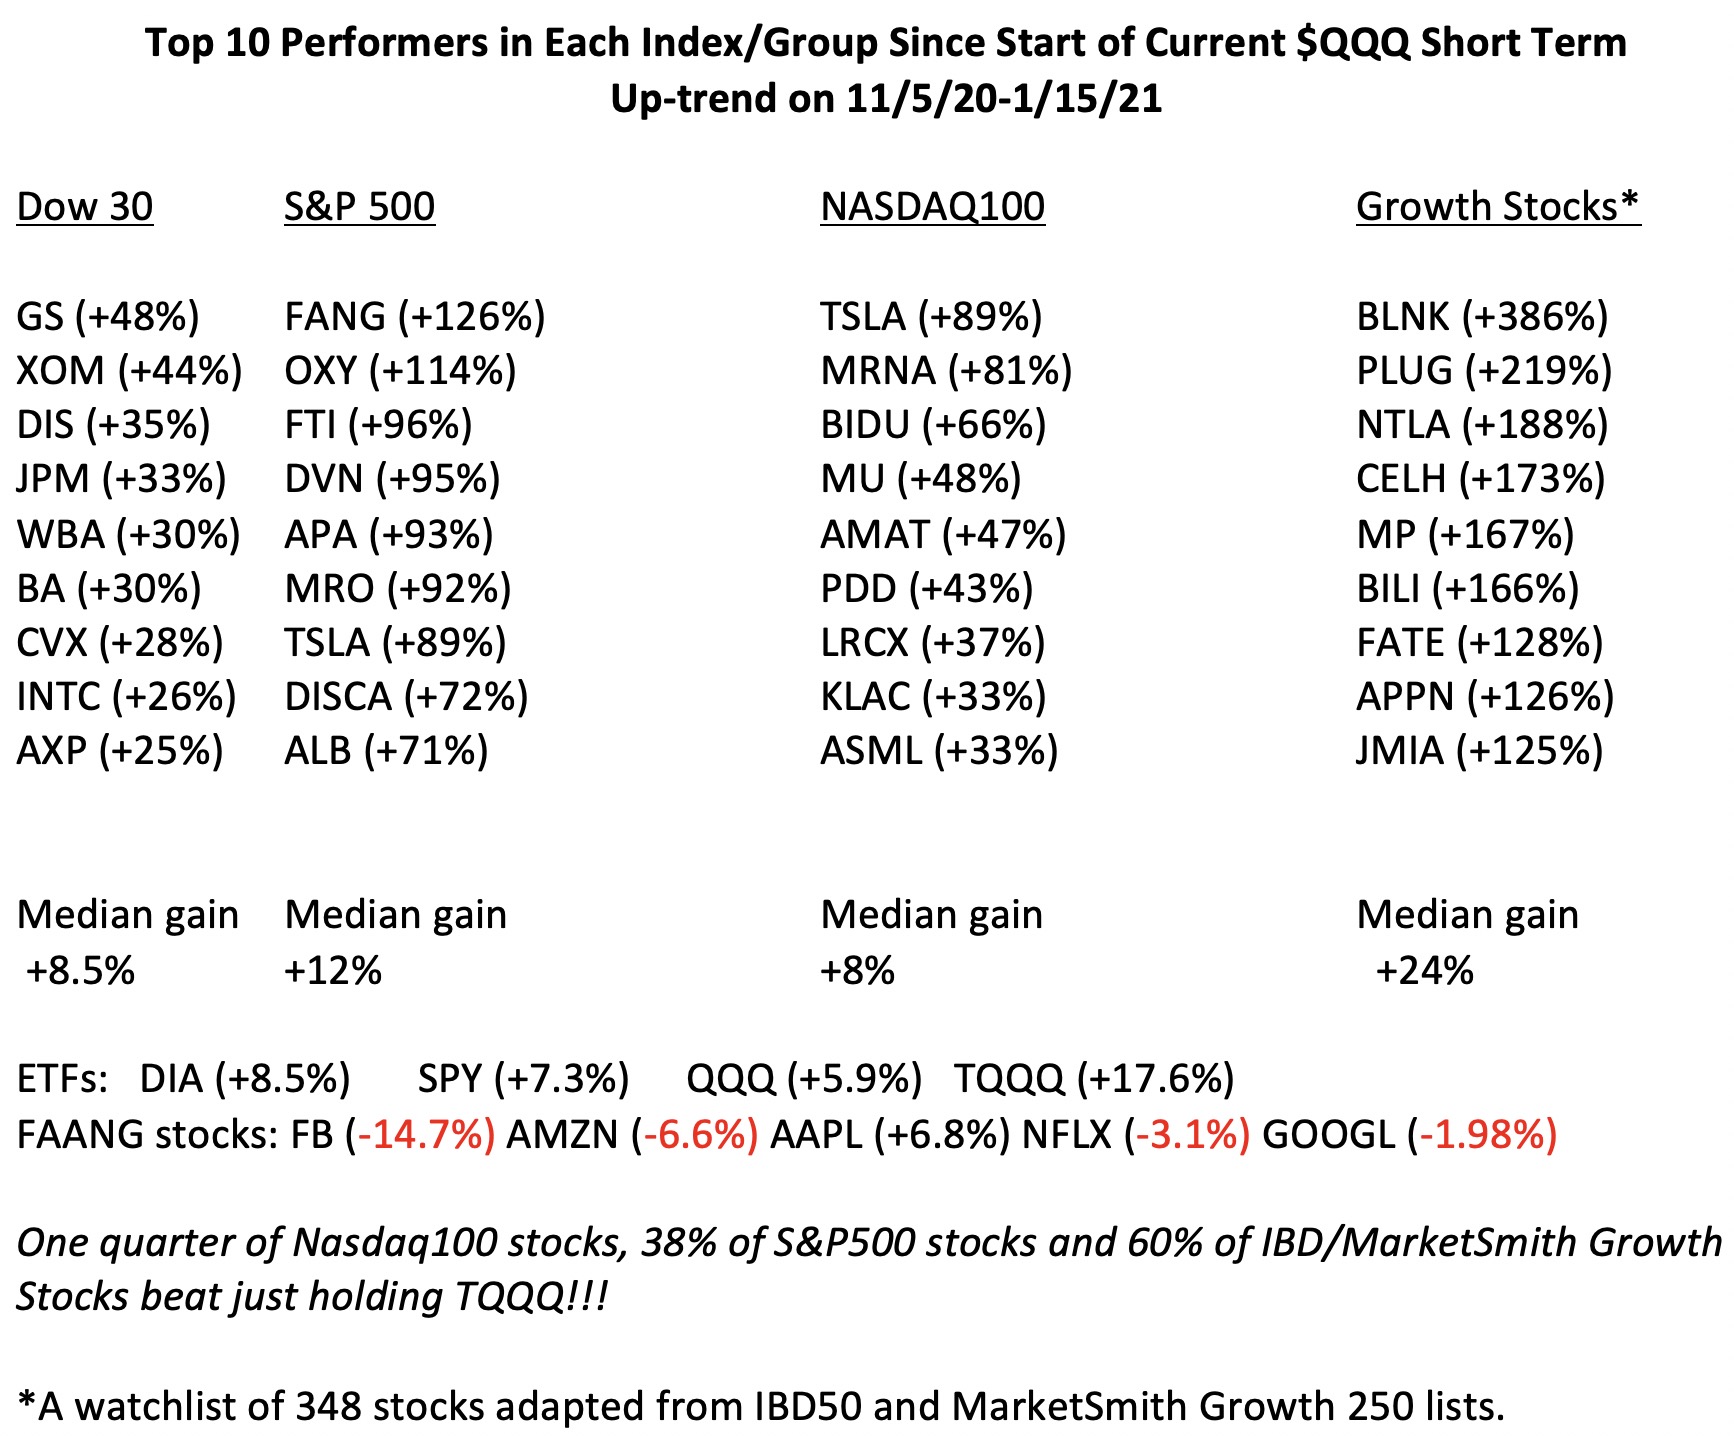
One other unexpected finding I have presented in this table is that all of the FAANG stocks but AAPL have declined during this period. My preferred market gurus (Darvas, O’Neil) have written that the market leaders top before the general market does. So this is one more warning sign for the current market along with the high percentage (63.7%, source investors.com) of newsletter writers currently being bullish.
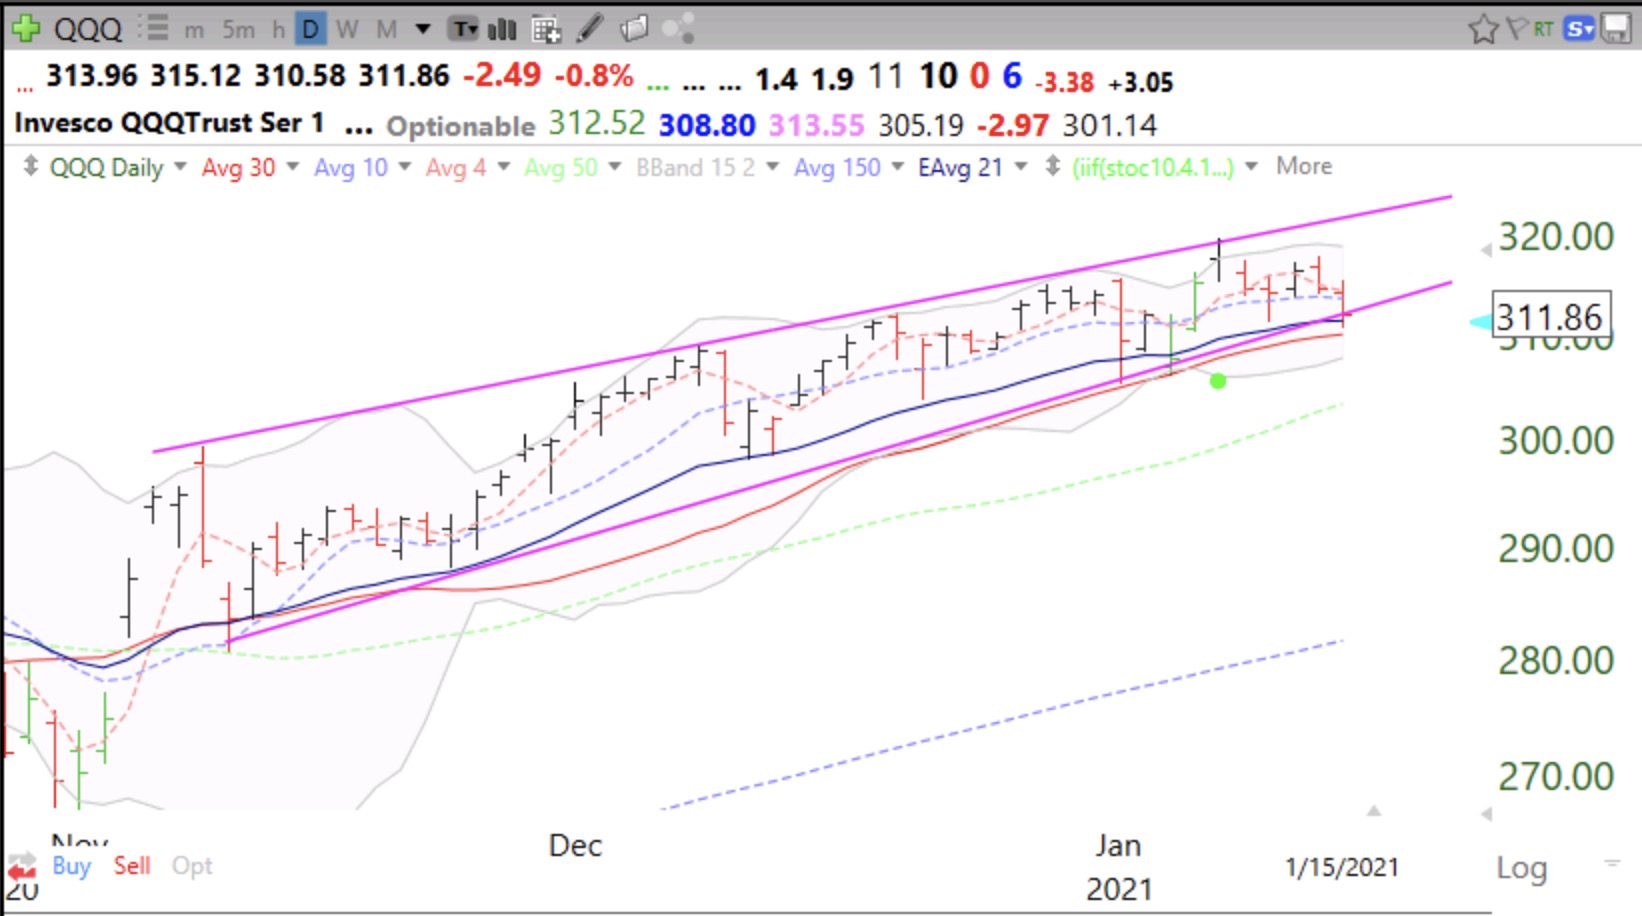
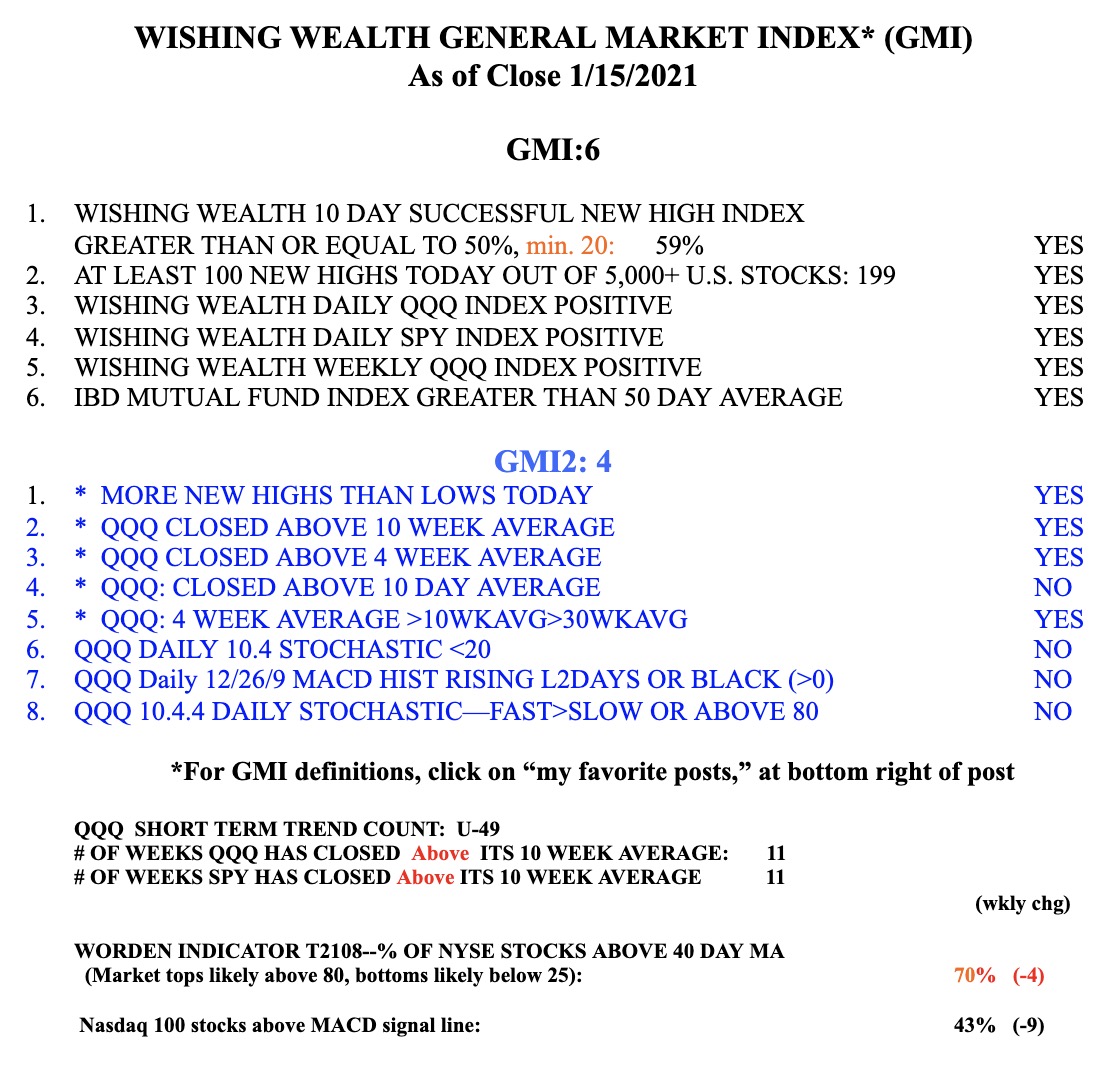
Nevertheless, the GMI remains Green and at 6 (of 6) but the more sensitive GMI2 is at 4, indicating some short term technical weakness. This chart shows that QQQ is sitting right on the bottom of its up-trend channel and therefore merits monitoring. This is where support has come in multiple times since November. And note that prior advances have stalled at the upper channel line. In addition, after closing above its 4 week average for each of the the prior 10 weeks, QQQ has now closed last week below it. Most strong up-trends have weekly closes above a rising 4 week average. Not using charts is like driving to new places without Waze! I can do it but it is much more difficult and I may get lost.