I will be presenting at free online meetings this weekend and next week. One is the TraderLion first annual conference on Saturday afternoon and the other is the Long Island Stock Traders Meetup. I will be presenting at 2:30 PM EST Saturday at TraderLion and at 7:30 PM EST Wednesday evening at the Long Island Meetup. I wlll present somewhat different material at each, including GLB, yellow-band, WGB, RWB, green and black dot set-ups. I will also show how I use TC2000 and MarletSmith to find promising stocks. Hope to see you there.
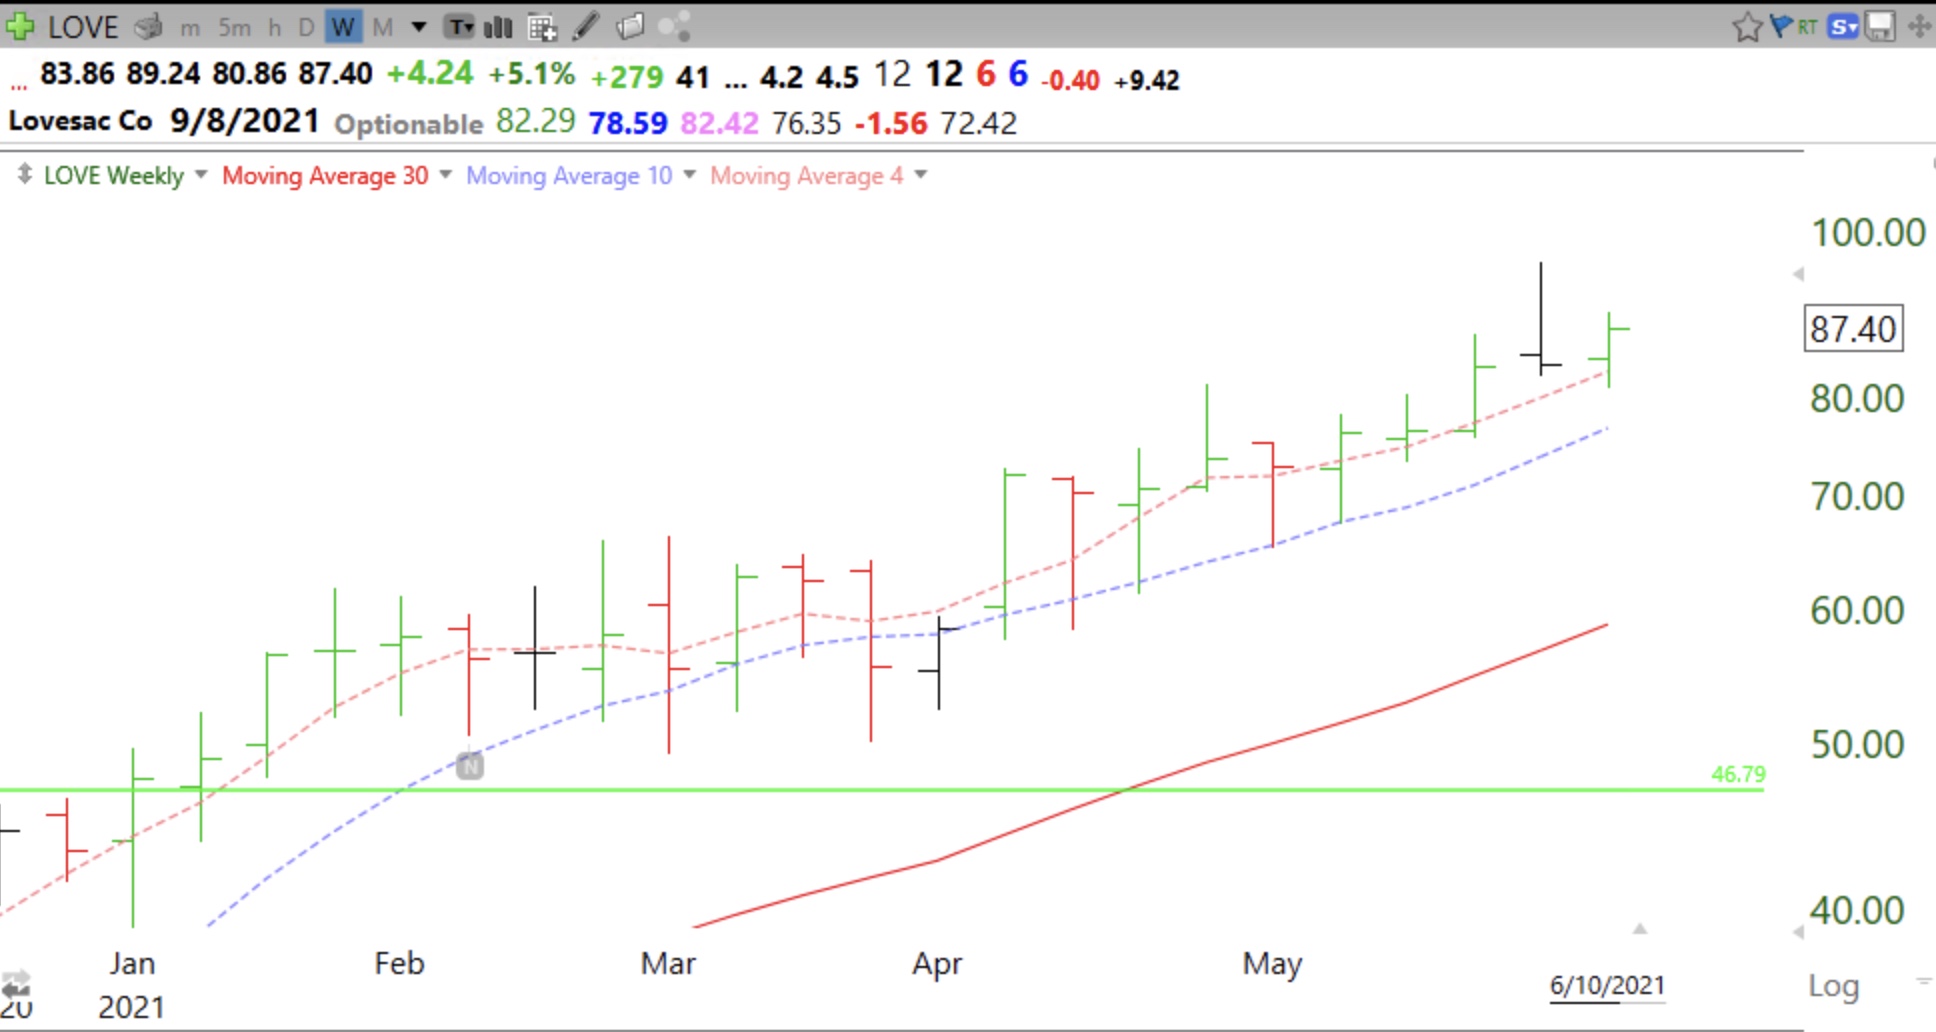
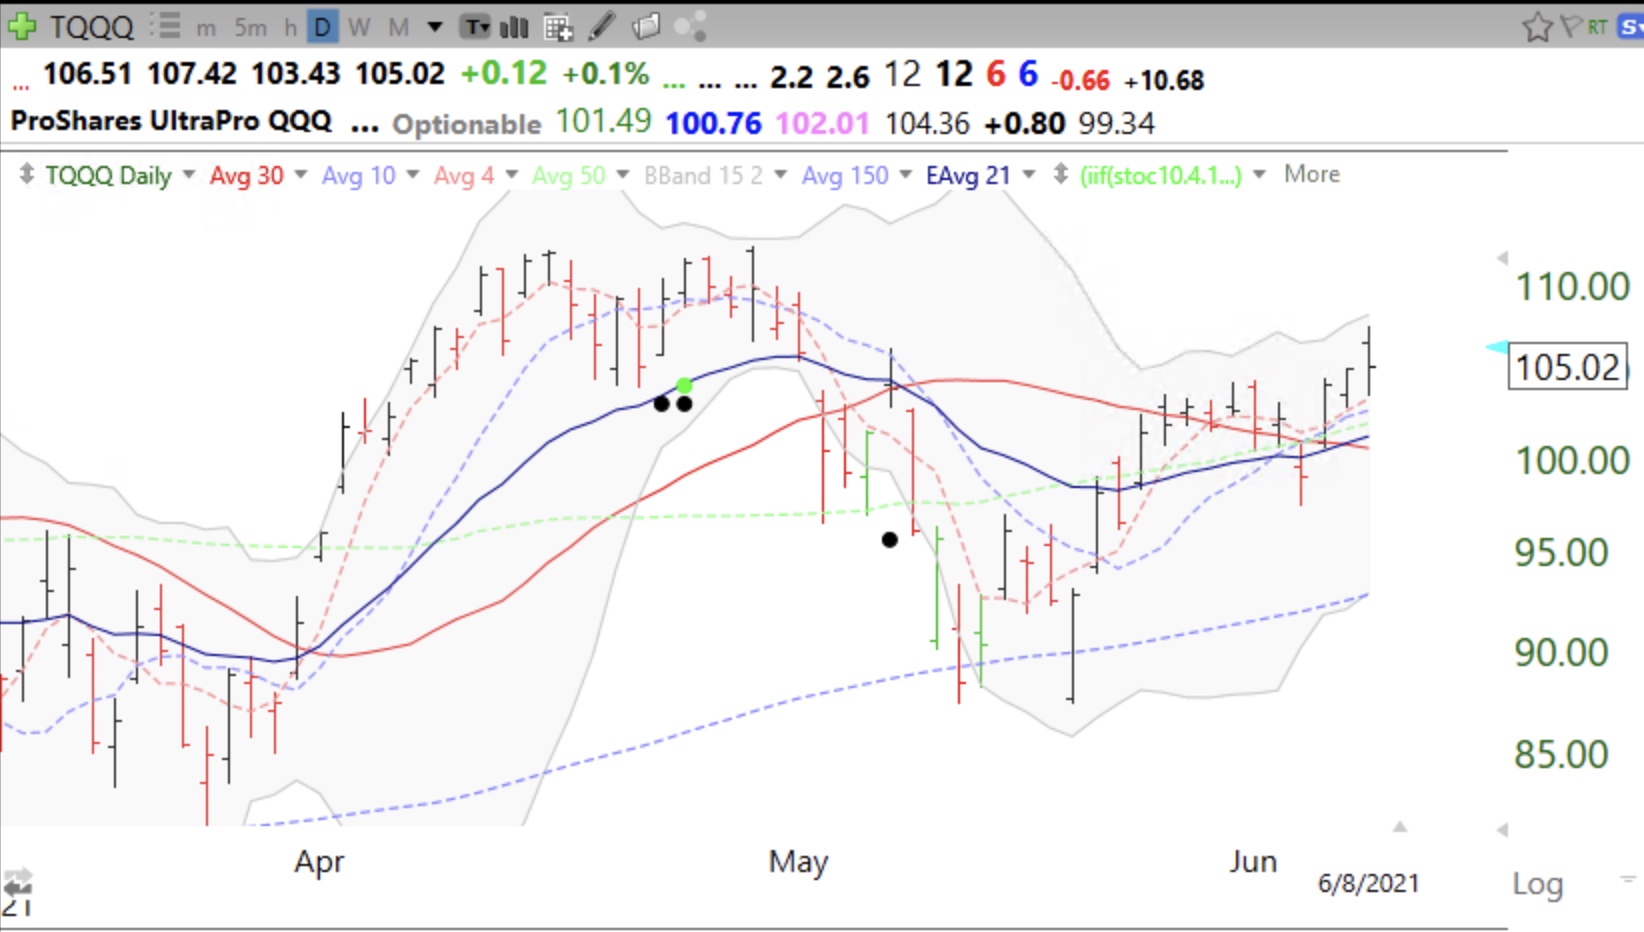
Growth stocks are gaining strength and $TQQQ is doing nicely. This weekly chart shows that $LOVE has a WGB (weekly green bar) signal, one of the indicators I will discuss at these meetings.