
Stock Market Technical Indicators & Analysis
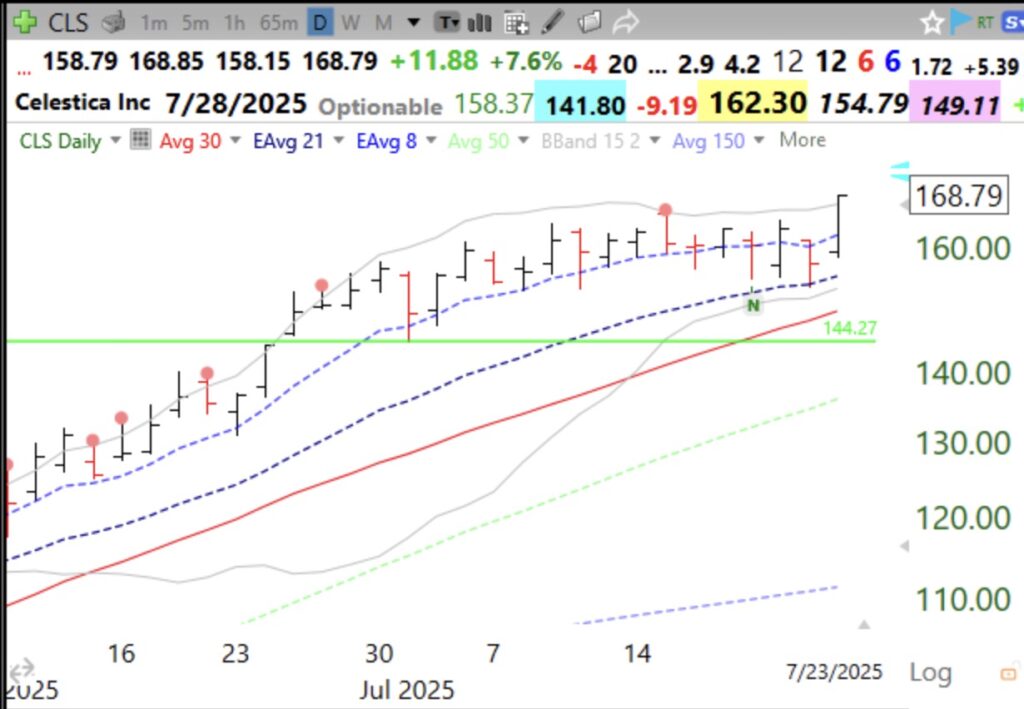
CLS had been tracking its 8 EMA beautifully and when it closed below it on Tuesday, I thought that it had broken trend. However, it retook its 8 EMA on Wednesday after finding support at the 21 EMA. If a setup fails and then succeeds, it can be a good trade to buy the stock back. Note how long CLS is also tracking its 4 wk average (red dotted line). That is another strategy to consider for identifying promising stocks. CLS reports earnings on 7/28.


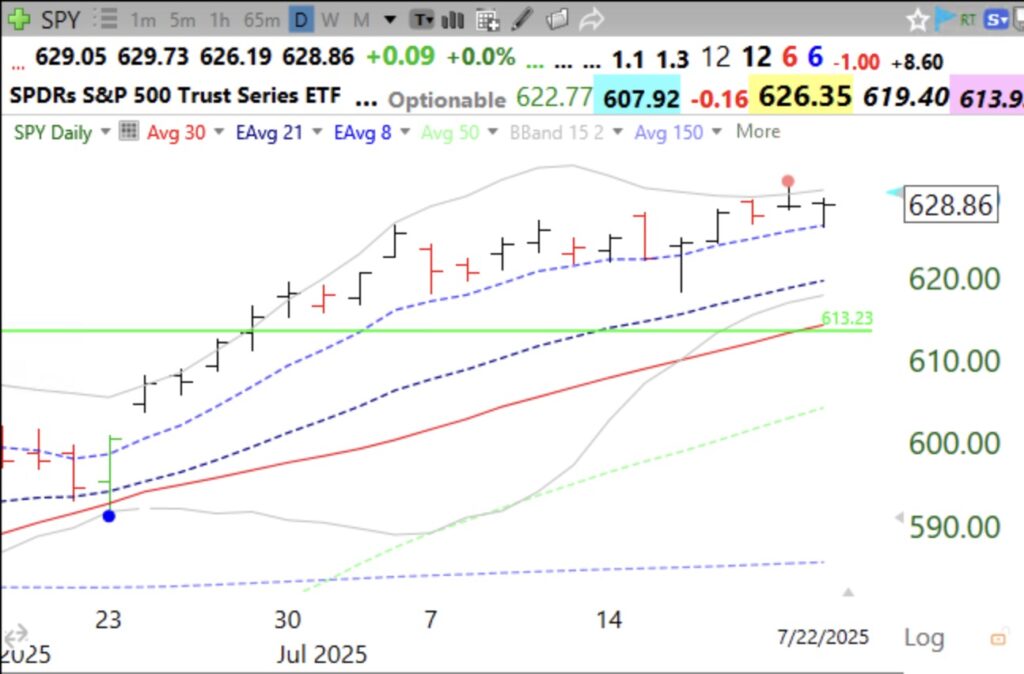
My Newhigh/8EMA Bounce scan showed that SPY recently had a GLB to an ATH and has been tracking its 8 EMA and bounced up off its 8 EMA on Tuesday. If I bought SPY on this setup I would sell SPY with a close below the 8 EMA or the green line, at 613.23. Note that SPY also had a blue dot (oversold bounce) on June 23 and has closed above its 8 EMA every day since June 25. It is also near resistance at the upper 15.2 daily Bollinger Band, as shown by the red dot. Let’s see if this setup holds or fails tomorrow. I will discuss these indicators with Richard Moglen at the TraderLion Conference on Sunday.
