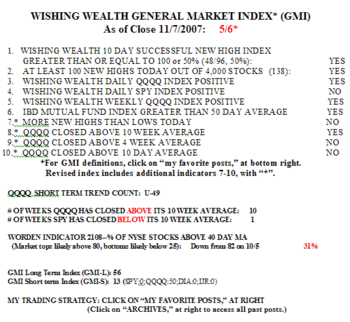
The GMI is still 6, but few stocks rose on Tuesday. Only 14% of the Nasdaq 100 stocks rose, along with 32% of the S&P 500 and 40% of the Dow 30 stocks. Only 20% of the IBD 100 stocks from 10/16 rose. Tuesday was the 42nd day of the current QQQQ up-trend. Cramer may have again signaled the short term top with his bullish comments on the Today Show last week….
Dr. Wish
GMI: 6; IBD100 stocks outperform Nasdaq 100 stocks
The GMI is still 6 and there were 410 new highs in my universe of 4,000 stocks on Monday. 54% of the Nasdaq 100 stocks advanced, along with 65% of the S&P 500 stocks and 57% of the Dow 30 stocks. Monday was the 41st day in the current QQQQ up-trend. What was striking Monday was the stronger performance of the IBD 100 stocks, compared with the Nasdaq 100 stocks. 80%-90% of the stocks in four recent IBD 100 lists advanced, compared with only 54% of the Nasdaq 100 stocks. Three of the four IBD 100 lists had more new highs on Monday than the Nasdaq 100 stocks. These differences suggest to me that the market leadership is moving towards stocks with great fundamentals and technical action, as defined by IBD. ….
GMI: 6; 417 new highs; IBD100 stock performance; Cramer Contrary Indicator Negative
The GMI continues at a maximum reading of 6 and the QQQQ stocks remain strong. There were 417 new yearly highs in my universe of 4,000 stocks. 88% of the Nasdaq 100 stocks closed above their 30 day average, the most since I began recording this statistic in June, 2005. On Friday, 61% of the Nasdaq 100 stocks advanced, along with 54% of the S&P 500 stocks and 50% of the Dow 30 stocks. Friday was the 40th day in the current QQQQ up-trend (U-40).
The IBD100 stocks from four recent periods performed pretty well on Friday. All four lists of stocks had more advancing stocks than the Nasdaq100, but the Nasdaq100 stocks were more likely (88) to have closed above their 30 day averages, a key sign of strength for me. Today’s new IBD100 list had the most new yearly highs on Friday (18). This is to be expected because IBD adds the most recent strongest stocks to the list and deletes the poor performers. Note that only 4 of the 100 stocks on the list published on 5/16 reached a new high on Friday. These 4 stocks might be considered stand-outs since they came through the summer decline and reached new peaks (AMX,TWGP,HITT,GYMB). In contrast, only 30% of the stocks on the IBD100 list from 5/16 closed higher on Friday than on the day that list was published. I might look closely at these four stocks , if I were not already fully invested…….
The media pundits are trying to guess how long this rise will continue. (Most missed its inception, so why listen to their predictions of its demise, anyway?) I don’t engage in that type of prognostication. My job is to determine when a trend is established and to ride it until it ends. I never get in at the bottom or out at the top. However, it is noteworthy that the Cramer Contrary Indicator (CCI) flashed a cautious yellow on Friday. Last time Cramer appeared on the Today Show he opined to Ms. Couric that we were in the best bull market since the 1920’s. That appearance was on the morning of Thursday, May 11, the day that the May through August 12% decline in the QQQQ index began. I mentioned on my post that evening that it was not so much Cramer’s bullish comments as the fact that the Today Show producers were so confident of his message that they let him come on the show. (Remember in the past how accurate contrary trading signals were provided when a bull or bear appeared on the cover of a major national magazine?) So what happened on Friday morning? Cramer comes back on the Today Show and tells a national audience that the market looks great from now through December. You be the judge of the accuracy of the CCI this time–should we drop the middle “C” ?