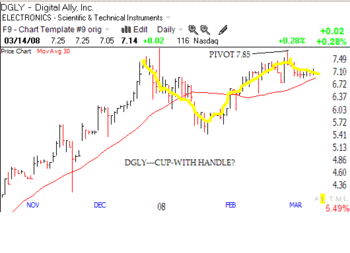
The GMI and GMI-R are back to zero. DGLY broke down on Monday, showing how promising bases tend to fail in a down-trend. Monday was the 51st day of the current QQQQ short term down-trend.
 Dr. Wish
GMI: 1; GMI-R: 1; 50th day of QQQQ down-trend; DGLY, cup-with-handle?
The GMI is one (of 6) and the GMI-R is one (0f 10). Friday was the 50th day of the current short term QQQQ down-trend. On Friday, there were 64 new highs and 304 new lows in my universe of 4,000 stocks. The number of new lows remains fewer than the number reached the prior Friday ( 504) and last January at the lows (1,453). The Worden T2108 indicator is at 27%, above the low reading of 19% on March 10. A reading of 19% is low enough to maybe constitute a market bottom, at least for now. 24% of the Nasdaq 100 stocks closed Friday above their 30 day averages, up from 10% on Wednesday. On January 23rd this statistic bottomed out at 10% with the market. So, in spite of the volatility we experienced last week, the market seems to be holding. But with the GMI and GMI-R at one, the Nasdaq 100 index remains in a confirmed down-trend, now in its 50th day. Since I labeled this down-trend on January 3, the QQQQ has declined 16.5%. During that time, 82% of the Nasdaq 100 stocks have declined, as have 78% of the S&P 500 stocks and 83% of the Dow 30 stocks. It clearly does not pay to fight the market trend! I either go short in a down-trend or stay safely in cash.
Still, I cannot resist looking for the next possible rocket stock to break out if this market should strengthen later this month (see my prior post). I scanned the market using TC2007 this weekend and discovered a stock that appears to be forming a nice cup-with-handle base (outlined in yellow) after a sharp up-trend.
(Click on chart to enlarge.) If DGLY should trade above the pivot point (about 7.85) with a large increase in volume, I just might be tempted to take a chance. I found an article that talked about the company’s huge recent increase in sales and have added this company to my watch-list. In this market environment, it will pay to wait for a high volume breakout before I bite.
GMI: 1; GMI-R: 2; Rally coming?
The GMI is now one, and the GMI-R is two. There are signs that a rally may be on the horizon. First, we are approaching the end of the first quarter and we can expect the mutual fund "window dressing" to boost the strongest stocks in the next two weeks. Why? Because each mutual fund quarterly report can show the presence of a stock in its portfolio without showing the date it was purchased. Thus, the fund manager looks like a genius who has held the winners for the entire quarter, instead of only days. Second, it is very rare for the Investor’s Intelligence poll to show more newsletters being bearish than bullish, but that is exactly the case now, and tends to happen near bottoms. Third, the MACD for the QQQQ index is showing a huge bullish divergence–the MACD failed to decline during Monday’s lower index low, to anywhere near as low as it (the MACD) reached in January’s decline. Fourth, the Worden T2108 indicator is now at 35%, up from 19% on Monday. And fifth, the percentage of Nasdaq 100 and S&P 500 stocks that are above their MACD signal line has been rising, suggesting at least near term strength in these stocks…
A lot of stocks I have been watching (RIMM, DAR, FDG, MOS, POT, CF, RRC, UPL) bounced off of support on Thursday. I may purchase some of these and place stops below Thursday’s lows. I already own FDG.

