The QQQ completed the second day of its new short term up-trend. There were 418 new 52 week highs in my universe of 4,000 stocks on Thursday.
 Dr. Wish
GMI: 6; new QQQ short term up-trend; RWB stock: OVTI
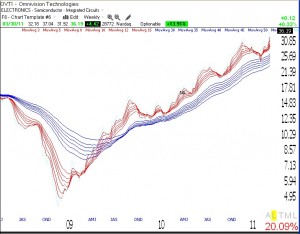
By my count, Wednesday was the first day of a new QQQ short term up-trend, within a longer term up-trend. I am now slowly wading into QLD and will add to my position as long as the new up-trend continues. I will be more certain of the staying power of this up-trend after it reaches its fifth day. There were 445 new 52 week highs in my universe of 4,000 stocks on Wednesday. Clearly, new highs are back in style and it makes sense to focus on strong growth stocks again. For example, OVTI is an RWB rocket stock that just reached an all-time high. Click on weekly chart to enlarge.
GMI climbs to 5, new IBD confirmed market up-trend
With the GMI and GMI2 both moving up to 5, it looks like the trend is turning up. IBD has now declared the market to be in a confirmed up-trend, even though we never got a big follow through day. Another up day in the QQQ will begin a new short term up-trend in that index. I have closed my short positions and am looking to establish long positions.
