In January, IBD discontinued the IBD100 list of stocks published each Monday and started publishing a shorter, better list of 50 stocks—IBD50. I rely heavily on IBD’s list of stocks because I am convinced that the high momentum growth stocks that meet their selection criteria do out-perform other stocks in a rising market. I have shown that in a declining market they do much worse. Hence the “M” in William O’Neil’s (IBD’s publisher and owner) CAN SLIM approach to trading stocks. The “M” signifies that one must trade consistent with the overall market’s trend.
I build watch lists in TC2000 periodically for the IBD100/IBD50 list published in Monday’s edition of IBD. While I recommend that people get a subscription to IBD so they can use their excellent website, some people may benefit from getting at least the Monday edition at the local newsstand. The first IBD50 list I stored was the one published on Monday, January 10, 2011. Over the weekend I computed performance statistics for the 50 stocks on the list since their close the Friday before publication through last Friday’s close. I compared the IBD50 stock performance to the stocks in the Nasdaq100 and S&P500 indexes.
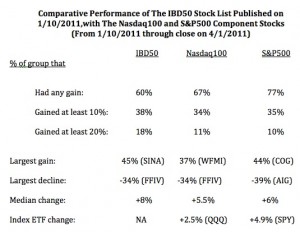
This table shows a few interesting things. During this time period, the Nasdaq100 index ETF (QQQ) advanced +2.5% and the S&P500 ETF (SPY) rose +4.9%. So this is a period when the nonfinancial tech stocks that make up the Nasdaq100 index and are most similar to the IBD50 type of stocks, underperformed the S&P500 type of large cap, stocks. Thus, the results for the IBD50 are probably poorer in this period than in periods when tech stocks are outperforming.
Nevertheless, the table tells an interesting story. Click on table to enlarge. A higher percentage of the Nasdaq100 and S&P500 component stocks rose (67% and 77%, respectively) than the IBD50 stocks (60%). However, more IBD50 stocks gained at least 10% or 20%.  In fact, the IBD50 stocks were much more likely to gain 20% in this period, 18% rose 20%+, compared to 11% of the Nasdaq100 stocks and 10% of the S&P500 stocks. The IBD50 stock list also contained a stock that gained the most, SINA (+45%), while the largest gainer in the Nasdaq100 stocks was WFMI (+37%) and in the S&P500 stocks, COG (+44%). The biggest loser in each of the 3 lists (FFIV and AIG) was down -34% to -39%. The median change (one half of the stocks did better than this value) for the IBD50 was +8%, larger than the median change in the other two lists (+5.5% and +6%), showing that the IBD50 stocks did outperform the other two lists of stocks.
My conclusion from this analysis is that in a period when tech stocks underperformed the general market, the IBD50 stocks did somewhat better. Most important the IBD50 list was a better place for finding large gainers. And to find the 20%+ gainers one only had to research 50 stocks instead of the 100 or 500 stocks in these other two indexes. Maybe IBD has a good idea here…..
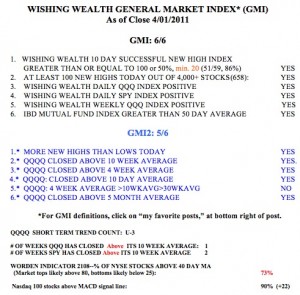
Friday was the 3rd day (U-3) in the new QQQ short term up-trend.  When it gets to 5 days, I will be more confident of its longevity. But keep in mind that the QQQQ and other major stock market indexes remain in longer term up-trends. Thus, I have not touched my long term university pension mutual funds. I only transfer them to money market funds when the major trends turn down. The GMI is at a very comfortable 6. The GMI2 is at only 5, because the pattern 4wk moving average > 10 wk > 30 wk is not present. The 4wk average remains below the 10 wk average. Both the QQQ and SPY are now above their 10 week averages, a promising sign. And 90% of the Nasdaq 100 stocks closed with their daily MACD above its signal line, a sign of strength. One note of caution is that the Worden T2108 indicator is at 73%, near the overbought levels where markets can top out. I will be concerned if the T2108 breaks 80%.
With the start of the short term up-trend I am starting to look for stocks to buy.  I used TC2000 to scan all of the IBD50 stocks that I entered into watch lists this year. I looked for stocks bouncing up off of their 10 week moving average. Many growth stocks, once launched, track their rising 10 week averages for months. I often buy such stocks after they bounce off of this average and place a sell stop slightly below the low of the week in which they bounced. All of the IBD50 stocks in this table showed up in my scan as having bounced their 10 week average last week. The second column shows the lowest price at which each stock traded last week and the point where I am looking to place a sell stop if I were to purchase one of these stocks. This would be a good list of possible buy candidates for my students and others participating in our simulated university stock challenge, UMDSMC, to research.


