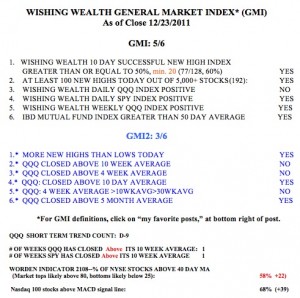
With the GMI at 5 and above 4 for two consecutive days, this indicator is flashing a bullish signal. I will be more comfortable if the QQQ holds on Tuesday and its short term trend turns up too.  The Worden T2108 indicator is in neutral territory, at 58%. 68% of the Nasdaq 100 stocks closed with their MACD above its signal line, a sign of short term strength. Only 25% of the Nasdaq 100 stocks have an over-bought stochastic, compared with 53% of the Dow 30 stocks. This difference reflects that the large cap stocks are currently out-performing the tech stocks. As I wrote previously, after a weak market people tend to feel more comfortable buying the big blue chip stocks than the more speculative growth stocks reflected in the QQQ. The smaller growth stocks take off later, once people have profits. Both the QQQ and SPY are back above their respective 10 week averages, a sign of strength.
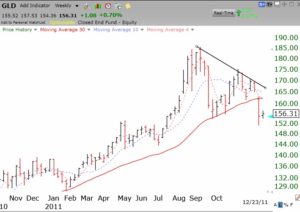
The QQQ reached a short term oversold level on December 19, and has bounced off of that level the past 4 days. The QQQ is getting close to an overbought level, as measured by stochastics and Bollinger Band indicators I use. I am therefore planning to move my stops up and/or write calls on my few long positions as soon as these indicators become over-bought. Over the past year, the QQQ has cycled between over-sold and over-bought. I am therefore not adding to any long positions right now. I am still looking to short gold once the consolidation from the recent sharp drop is over. This could take weeks. Check out this weekly chart which shows GLD now firmly below its 30 week average (red line) and entering a major Stage 4 decline. Click on weekly chart to enlarge.
